 The Water Supply Stress Index (WaSSI) Dashboard, developed by the USDA U.S. Forest Service is an easy-to-use, FREE, online tool that helps producers see how changes in land use, climate, and water use might affect rivers, water supply, and rangeland’s ability to grow herbaceous plants and maintain ecosystem services. It uses weather and land data to determine water flow and plant growth, so users can understand various management strategy impacts and make smart choices about managing rangeland and watersheds.
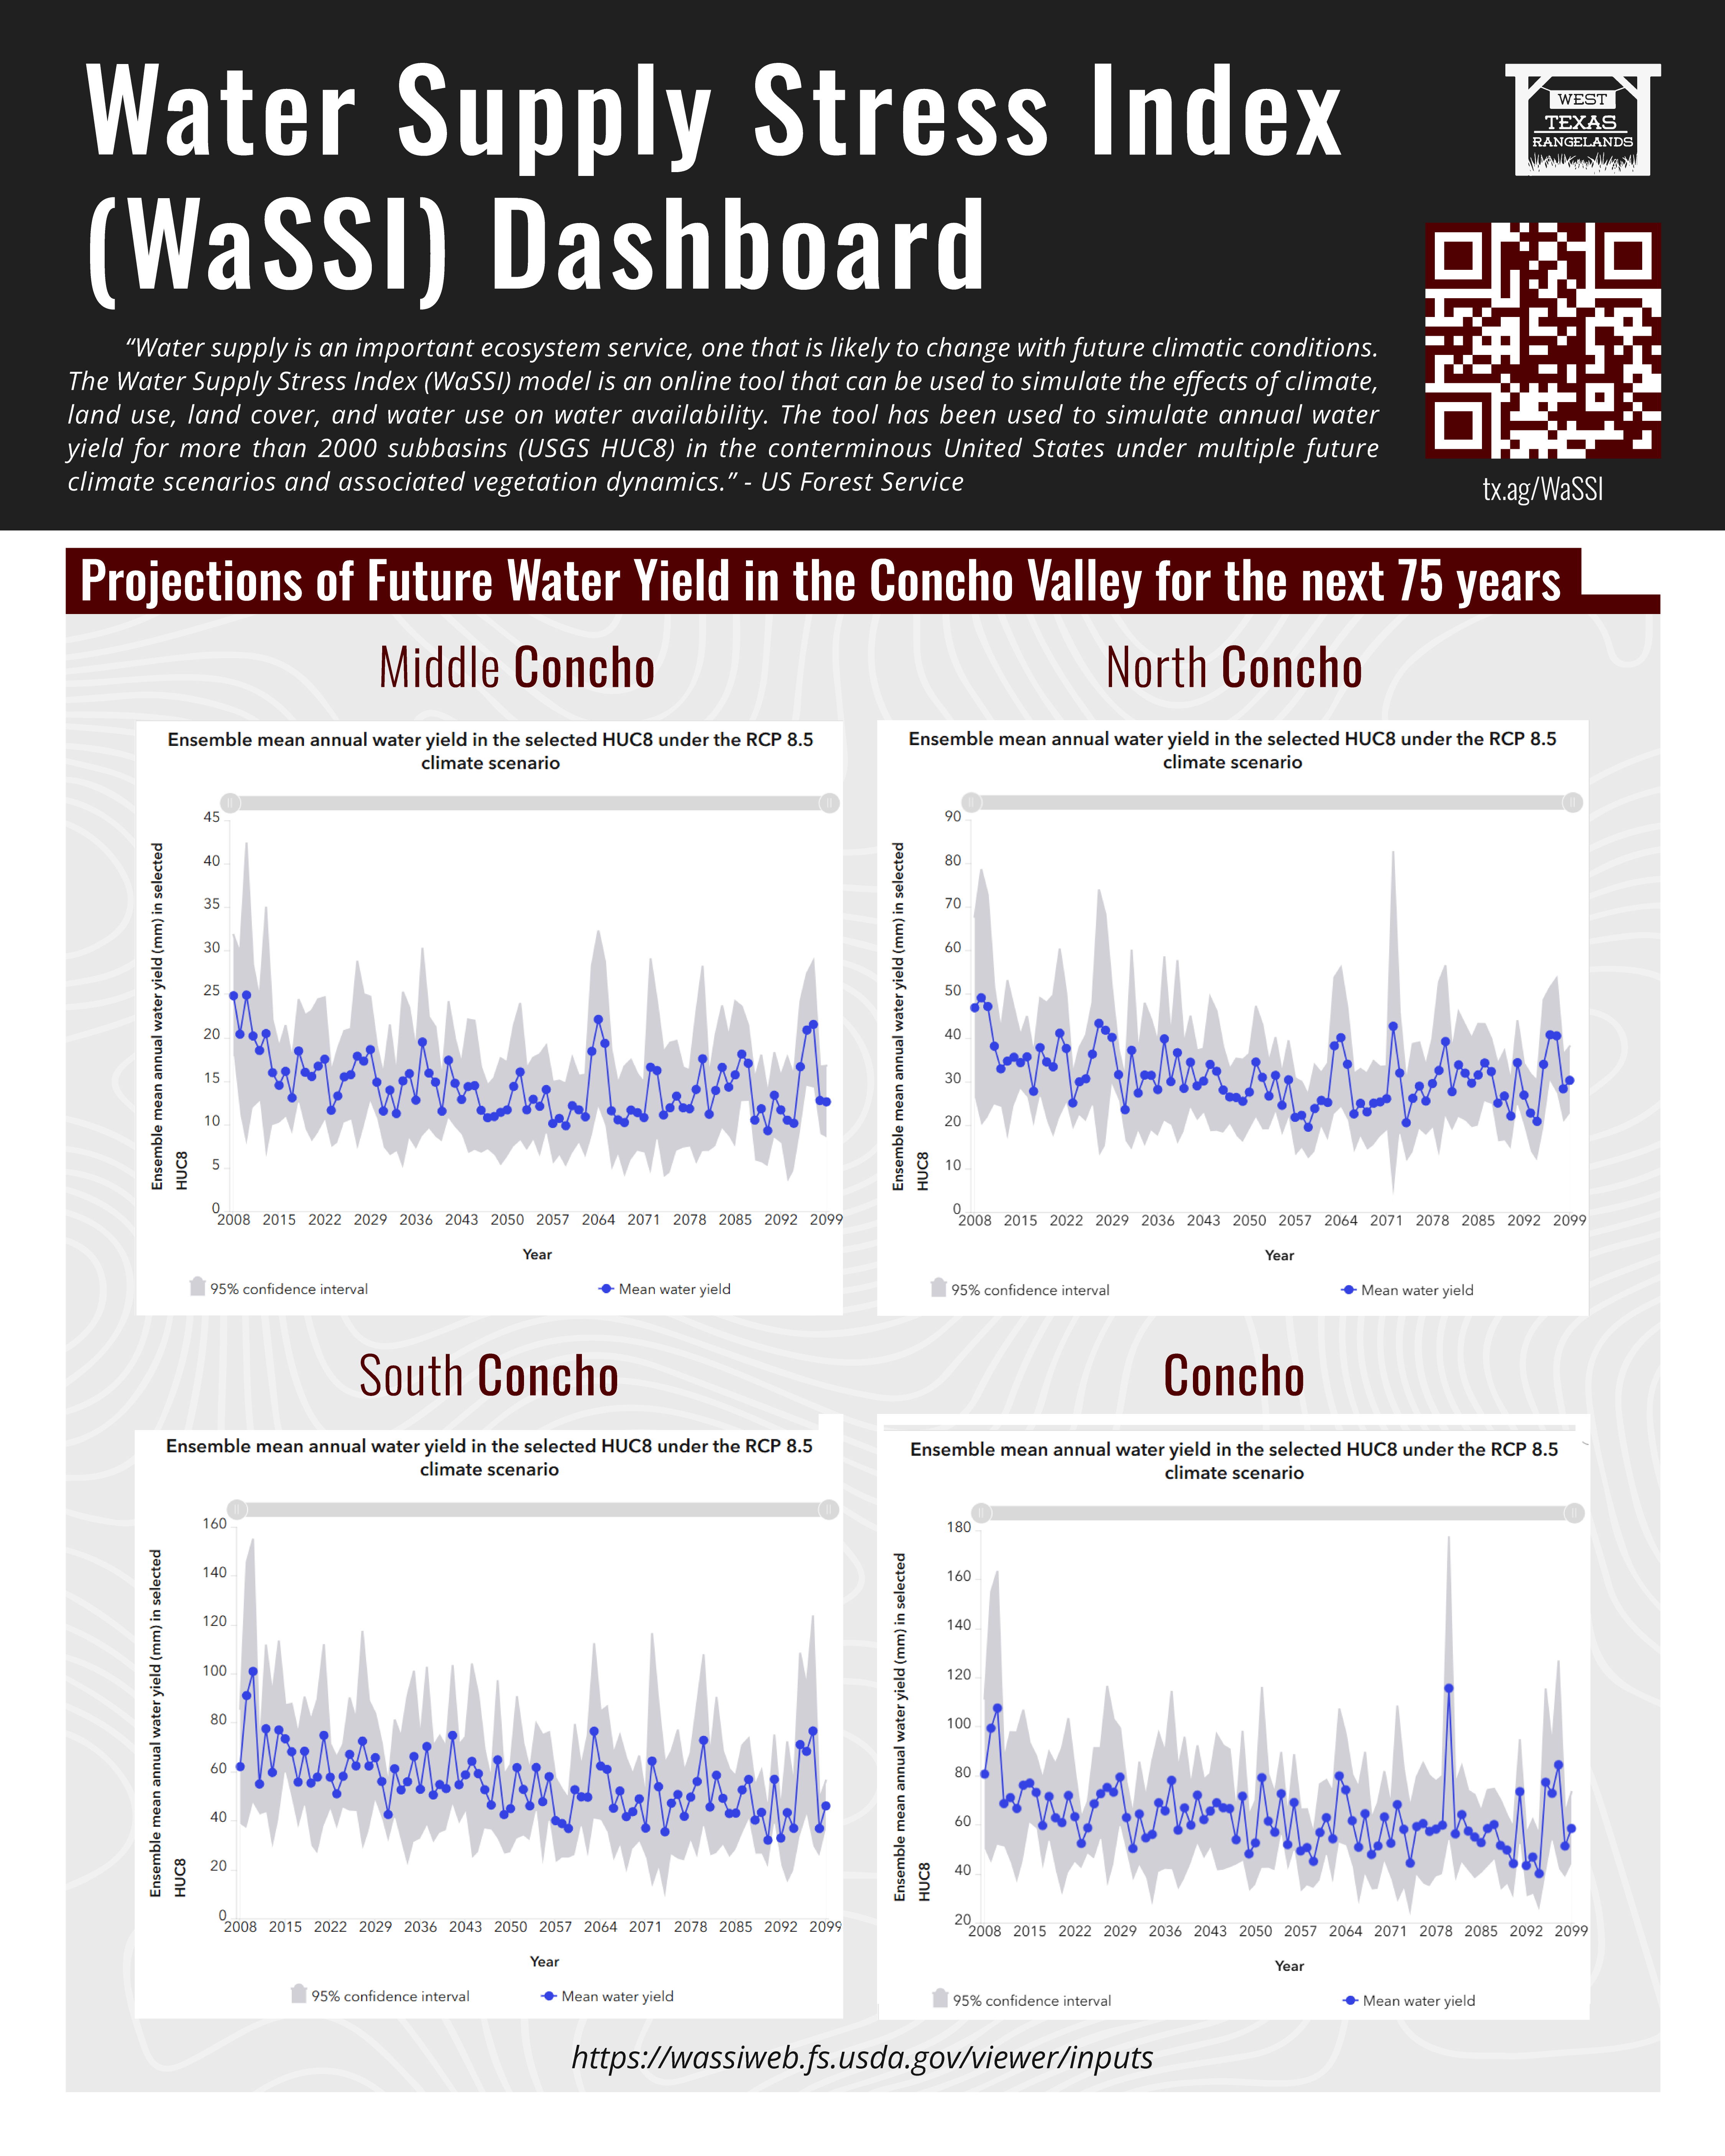
This intriguing new dashboard tool showcases watershed climate (1961-2015), land cover distribution (%), water use (%), leaf area index (2000-2012), groundwater withdrawal (2005), and projected population (2010-2060)! For example, managers can glimpse into future water yield projections for all watersheds spanning the next 75 years. Using the WaSSI model, researchers can simulate the impact of climate change, land use, land cover, and water consumption on water availability across more than 2,000 subbasins (USGS HUC8) in the contiguous United States.
The examples in the graphic focus on four key areas within the Concho Valley: Middle Concho, North Concho, South Concho, and Concho. For each area, the dashboard displays graphs projecting the ensemble mean annual water yield under the RCP 8.5 climate scenario. This scenario represents a high greenhouse gas emissions pathway, providing a crucial outlook on potential future water stress coupled with extreme climatic shifts.
Why is this important?
Understanding future water availability is paramount for West Texas ranchers, farmers, and communities. The WaSSI Dashboard provides crucial insights for:
- Resource Management: By anticipating potential water scarcity, stakeholders can implement strategies for water conservation and efficient allocation.
- Land Use Planning: Projections can inform decisions about land development, agriculture, and infrastructure, ensuring long-term sustainability.
- Climate Change Adaptation: The dashboard highlights the potential impacts of climate change, enabling proactive adaptation measures.
The WaSSI Dashboard is accessible online here!
By exploring the dashboard, users can gain a deeper understanding of future water projections for various regions across the United States.