I’m struck (again) by the fact that how you view the world is affected by your news sources. Last week, the Commerce Department released its advance estimate of second quarter 2021 gross domestic product (GDP). Whether you think the economy is experiencing “some of its strongest ever quarters of economic growth” or “could soon be on the verge of economic disaster” depends where you read the story.
The numbers and press release from the Commerce Department are probably somewhere in between those two narratives. All the press agree that real (inflation adjusted) GDP increased at an annual rate of 6.5 percent in the second quarter (April – June 2021). Their estimate of first quarter GDP growth was revised 0.1 percent lower to 6.3 percent.
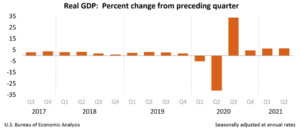
Where people seem to disagree is in interpreting those numbers. Are they high or low? According to the Commerce Department information in Figure 1, they represent above average quarterly growth.
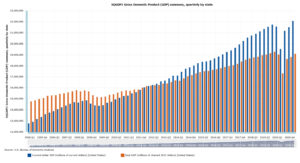
It’s probably fair to look at real GDP values in addition to percentage changes from the previous quarter. The BEA data in Figure 2 show the precipitous drop in the second quarter of 2020 and steady increases since the third quarter of last year. Figure 3 shows a longer time horizon. On the right side of the chart, we see larger stair-steps in recent quarters as compared to preceding years, although we’ve not yet climbed back to late 2019 real GDP high point. However, if we are looking at nominal (current) dollars, second quarter 2021 GDP does reach an all-time high (Figure 4).
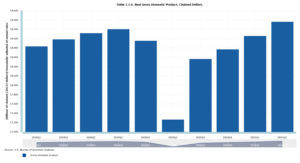
Figure 2. BEA Table 1.1.6 Real Gross Domestic Product, Chained Dollars [Billions of chained (2012) dollars] Seasonally adjusted at annual rates. Last Revised on: July 29, 2021.
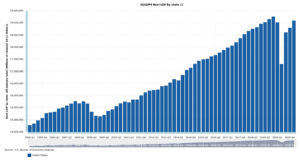
Figure 3. BEA Table SQGDP9 Real GDP by state (US Total); Real GDP by state: All industry total (Millions of chained 2012 dollars).
When we think about what all these numbers mean to average Americans, it can be helpful to think about personal income and inflation as well. Those data are available from the BEA interactive data site and are discussed in the second quarter GDP news release as well. Nominal personal income fell by $1.3 trillion (22.0 percent) to $20.6 trillion, down from $21.9 trillion in the first quarter 2021 (Figure 5); the Commerce Department cites the decrease in COVID relief payments as the primary driver of lower income. Nevertheless, personal consumption expenditures increased and savings decreased. The price index increased, which affects these consumptions expenditures, but the inflation story is interesting in itself.
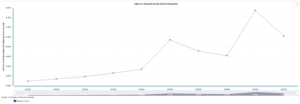
Figure 5. BEA Table 2.1. Personal Income and Its Disposition [Billions of dollars] Seasonally adjusted at annual rates. Last Revised on: July 29, 2021
A quick note on those price indexes. Prices do not change equally across time. While we do see larger increases in the NIPA price indexes in recent quarters, some sectors have remained relatively stable prices while prices in other areas have increased dramatically (See Section 2: Personal Income and Outlays; Table 2.3.4. Price Indexes for Personal Consumption Expenditures by Major Type of Product.) For example, motor vehicles and parts experienced a jump from 102.3 to 110.7 (8.4 points) between the first and second quarters of this year. The index for gasoline and other energy goods, which have highly variable prices, increased by almost five points. Food for home consumption increased by 1 point over the past quarter, having experienced its largest jump as the pandemic started. Overall, goods increased by 2.1 points versus the overall price level increase of 1.8 and the services increase of 1.5. In the longer term, inflation among services continues to outpace inflation in prices of services though.
