‘Tis the season. Or ’twas the season anyway. Texas high school football playoffs. I like small town football. Both my brothers played six-man football in Kansas. My son goes to a small school where the elementary kids get to run out on the field with the football players and stay there through the Star Spangled Banner. You see everyone at a small town football game. That’s what I really love–the sense of community around rural schools and their activities from junior high volleyball games to Kindergartners’ Veterans Day programs.
At my first meeting in rural Texas, legislators said their rural constituents wouldn’t work together across town lines because they played each other in football. Almost 10 years down the road, I see more regionalism and cooperation. But Texans still have a lot of pride in their local teams.
This year, our livestock economist reported a conversation that started with the football team’s chance of success and then turned toward economic development. That got me thinking about some football data I’d started looking all those years ago when I’d wondered if there was actually any correlation between winning teams and community population growth, particularly in the smallest communities. So my student worker did a quick pull of some more recent win-loss records and updated the population file. The unsurprising answer: No, not really.
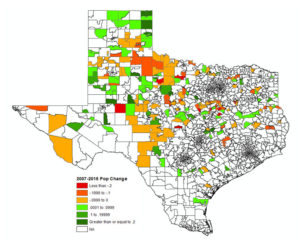
But there are some interesting things underlying that result. The 2015 records for 6-man football (my personal favorite and the purview of the smallest communities and schools) and 2007-2015 town population growth are shown in the tables below.
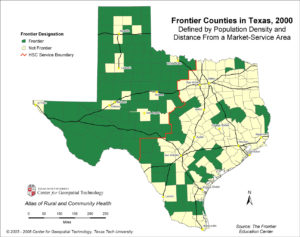
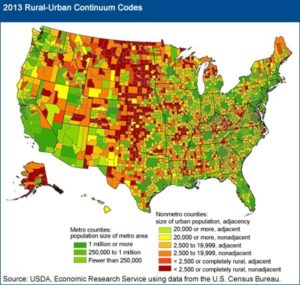
These communities (ZIP codes in the graphs above, and some six-man schools are missing due to data constraints) tend to be more prominent in West Texas. But that is largely a function of low population density and thus large ZIP code areas. Population growth or contraction hasn’t led to winning or losing teams (and it’s unlikely that the teams’ records affect population growth either). When you look at a map of rural America, these are the Texas counties that the USDA codes as being more remote, rural and that are often considered Frontier counties.
These notions have implications for how we might think about school consolidation (If you are a very small school occupying a large territory, what affects the feasibility of transporting kids to another district?) and funding (What are the geographic distribution affects of changes to the 300-square-mile rules regarding the state’s basic allotment?). Certainly the full consideration of these questions is outside the scope of a few maps. Questions abound about rural school quality, cost-effectiveness, and opportunity. But the maps do show interesting things about our rural schools and their regions.


