This post is part of an eight-week series on Cultivating Community Wealth.
“Understanding the distribution of wealth across and within communities is also critical if community-level interventions are to be most effective in building on existing assets.”
—Pender, Marre, and Reeder, 2012, p.6
The previous Defining Wealth post discussed the importance of improving the prosperity of those on the economic margins (described fully in the WealthWorks curriculum). Pender, Marre, and Reeder (2012) note that improving a community’s aggregate wealth may not improve the economic situation of everyone in the community.
Our Texas oil boom provides an excellent example. Oil and gas production have increased aggregate incomes and tax bases in many Texas communities and counties. Household incomes may increase through royalties paid to mineral owners (those who already held a form of undeveloped wealth) or through the relatively high wages paid to oilfield employees. These higher incomes can push rents and other prices higher. However, the poor can be worse off if they face higher prices but stagnant wages or fixed incomes. Poor households’ disadvantages can be compounded by disability, age, skill deficiencies, drug use, or criminal records—all factors that can inhibit participation in the labor force.
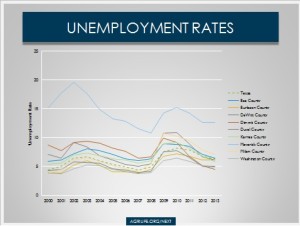
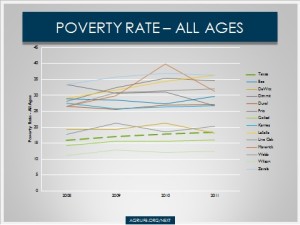
Higher median incomes can be accompanied by greater inequality. Despite higher incomes in the Eagle Ford since 2008, the poverty rates in many counties have remained stubbornly high and have even increased in some cases. Unemployment has remained above the Texas average as well. (Hear more about this topic in my AgriLife NEXT talk.)
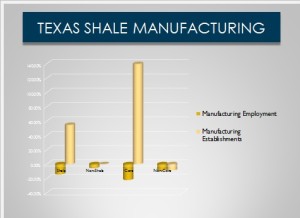
From a business perspective, other sectors’ wages may be driven up to compete with oilfield pay. Sectors that must export their products may not be able to pass those higher labor costs to consumers. My research shows that while the number of manufacturing establishments has increased in the Texas shales, manufacturing employment has decreased, although this is not solely attributable to oil wage competition.
This is not to say that the oil and gas industry is not an important sector contributing to local economies. Even residents with no direct benefit from the industry do often benefit from tax-funded publicly provided goods and services. But, again, we need to be realistic about how wealth is distributed in the community—who are the “winners” and “losers”—when we consider development alternatives. And we need to consider potential alternatives to make “losers” better off. If that sounds a bit of moralistic speech that has no business coming from an economist, consider the practical side: people who perceive themselves as “losers” are likely to try to stop a development plan. Furthermore, marginalizing a group can lead to blight and inhibit their ability to participate in and enhance the regional economy and community. In community, considering the entire community isn’t just the right thing to do; it makes business sense too.
Vornovitsky, Gottschalck, and Smith (2013) note that household wealth inequality increased between 2000 and 2011, although it decreased slightly from 2010 to 2011. The ratio of the highest quintile’s median household net worth to the second-lowest increased from 39.8 in 2000 to 86.8 in 2011. In other words, the highest fifth of American households had almost 87 times as much net worth as the second fifth of households. Note that the lowest quintile was excluded from the analysis because many households had negative wealth. In fact, median net worth for this group was negative.
Furthermore, in constant, inflation-adjusted dollars, median net worth fell for the lowest three quintiles and increased for the fourth and highest quintiles, as shown in Vornovitsky, Gottschalck, and Smith’s (2013) Figure 1, copied below:

figure 1 from Distribution of Household Wealth in the U.S.: 2000 to 2011
By Marina Vornovitsky, Alfred Gottschalck, and Adam Smith
http://www.census.gov/people/wealth/
Marre (2014) cites previous research showing that rural areas tend to lag metropolitan ones in terms of net worth, assets, and other measures. He notes that rural labor markets tend to provide lower wages. Marre cites Glaeser and Mare (2001) who found that when rural residents move to cities, they obtain higher wages and faster wage growth.
Furthermore, rural areas tend to have industries that are nearer the end of their life cycle and pay lower wages. For example, cutting-edge high-tech equipment tends to be created in urban centers. As a product and its production process becomes less innovative, production may move to more rural areas with lower labor and land costs. Ultimately, production may move to an even cheaper foreign location.
However, Marre (2014) found that, of four categories (financial capital, home equity, the value of farms and businesses, and other property), rural areas and metro areas did not significantly differ in the value of farms and businesses or other property. There was also no significant difference in the total household net worth of rural and urban counties. The difference in rural-urban financial capital was explained by demographic factors, initial wealth, and wages. Home equity difference appear to be a function of similar factors as well as lower overall rural home prices and a mitigated rural housing bubble during the 1999-2009 study period. Significant demographic variables included age, race, education, and marital status.
In their book, Changing Texas (2014), Murdock et al. note that inequality is likely to be a challenge for Texas in the next 40 years. An older, more diverse population may result in a less educated, poorer Texas. Next week’s post discusses the effects of changing Texas demographics and opportunities to improve economic outcomes for the state, its individual residents, and traditionally marginalized populations.
Resources:
Rural Wealth Creation
www.rurdev.usda.gov/Reports/rd-ERR131.pdf – USDA-ERS report related to the book
http://www.choicesmagazine.org/choices-magazine/theme-articles/rural-wealth-creation/theme-overview-rural-wealth-creation – Choices Magazine issue on the subject of rural wealth, mostly by book authors
WealthWorks
http://www.wealthworks.org/
Wealth Creation and Rural Livelihoods
http://www.wealthworks.org/ – includes a forum and listserv
Dudensing, Rebekka. 2014. Energy Development in Texas: Impacts on Local Communities and Economies. Texas A&M AgriLife Extension Service NEXT Talk Handout. http://agecoext.tamu.edu/files/2014/08/next-Energy-Community-Development-Handout-RCweb.pdf
Glaeser, Edward L., and D avid C. Mare. 2001. “Cities and skills”, Journal of Labor Economics, 19(2): 316-42.
Marre, Alexander. 2014. The Net Worth of Households. In Rural Wealth Creation, John L. Pender, Bruce A. Weber, Thomas G. Johnson, and J. Matthew Fannin, eds. Routledge, New York.
Pender, John, Alexander Marre, and Richard Reeder. 2012. Rural Wealth Creation: Concepts, Strategies, and Measures. U.S. Department of Agriculture, Economic Research Service. Economic Research Report Number 131. Washington, DC: March. www.rurdev.usda.gov/Reports/rd-ERR131.pdf
Murdock, Steve H., Michael E. Cline, Mary Zey, P. Wilner Jeanty, and Deborah Perez. 2014. Changing Texas: Implications of Addressing or Ignoring the Texas Challenge. Texas A&M University Press: College Station, Texas.
Vornovitsky, Marina, Alfred Gottschalck, and Adam Smith. 2013. Distribution of Household Wealth in the U.S.: 2000 to 2011. U.S. Census Bureau. Washington, DC: March. http://www.census.gov/people/wealth/


