Base Knowledge
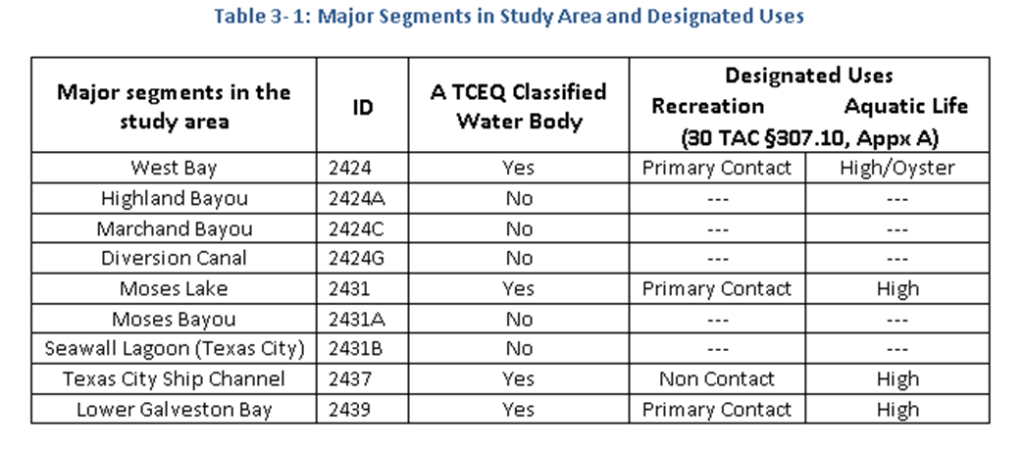
The major surface waters—rivers, lakes, bays, and the Gulf waters—of Texas are classified into ‘segments’ for water quality management purposes. TCEQ has furthermore assigned all segments into one of twenty five separate basins or watersheds in the state. All water bodies in the Highland Bayou study area are located in Basin 24, ‘Bays and Estuaries.’ Below is a table illustrating the different segments in the study area, it’s ID number assigned by TCEQ, whether it is classified by TCEQ and the segment’s designated uses.

The assignment of a designated use to a specific segment is contingent upon a range of factors relating to historical uses, actual uses, and desired uses of that segment. Uses are designated by TCEQ through agency study and review of specific segments. Of the five use categories, there are two use categories that are relevant to the Highland Bayou’s 303(d) listing: Recreational Use and Aquatic Life Use. Recreational Uses refer to human recreational use of water, and are divided into four levels of activity. Water quality criteria become more stringent when there is an increased likelihood of ingestion of water from recreational use. Unless a specified recreational use is designated in for a specified segment, the assumed use is Contact Recreation. Contact Recreation can be broken down into:

- Primary Contact Recreation refers to activities where there is a significant likelihood of ingestion of water. This includes activities such as wading, swimming, water skiing, diving, tubing, surfing, and whitewater paddling or rafting.
- Secondary Contact Recreation 1 refers to activities where the likelihood of the ingestion of water is low, such as fishing, adult wading, canoeing, kayaking, rafting, and motor boating.
- Secondary Contact Recreation 2 refers to limited body contact incidental to shoreline activity and pose less likelihood of ingestion than SCR1. The distinction between 1 and 2 is based physical characteristics of the water body or access at the shoreline.

Aquatic Life Uses (ALU) refer to water quality conditions that support levels of aquatic life activity.
ALU standards for unclassified waterbodies are presumed to be ‘High’ (Texas Commission on Environmental Quality, 2010a). There are five levels of Aquatic Life Uses.
- Exceptional ALU waters have outstanding habitat characteristics and species assemblages. Species diversity and richness are exceptionally high.
- High ALU waters have high diversity and the usual assemblage of species expected for that waterbody. Also, species diversity and richness will be high, although not exceptional. The trophic structure or food chain may be slightly imbalanced.
- Intermediate ALU waters have only moderate habitat conditions and some expected species are missing. Species diversity and richness is moderate and the food chain is moderately imbalanced.
- Limited ALU waters are the least supportive ALU level. Habitat is uniform and most expected species are absent. Species diversity and richness are low and the food chain is severely imbalanced.
- Oyster waters are assigned to waters so that concentrations of toxic materials do not cause edible shellfish to exceed accepted public health guidelines. This designation is paired with an ALU subcategory and is not a standalone use.
Water Quality Standards
Bacteria standards are linked to Recreational Uses and vary by the likelihood of ingesting water from the designated use. The same bacterial standards apply to both classified and unclassified segments. Bacteria sources are primarily from human and animal wastes. Below is a table illustrating the bacterial standards developed by the TCEQ. These standards are used to determine is a segment is impaired and in turn placed on the TCEQ 303 (d) list.

Dissolved oxygen standards are linked to Aquatic Life Uses. The standard increases with increasing quality of the aquatic life use designation. Spring standards apply to freshwater segments during the spawning period for fish. Low levels of dissolved oxygen may be the result of excessive algae growth which uses pollutants like nitrates and phosphorous to grow. Below is a table illustrating the dissolved oxygen standards developed by TCEQ. These standards were used to evaluate the segments in the study area.

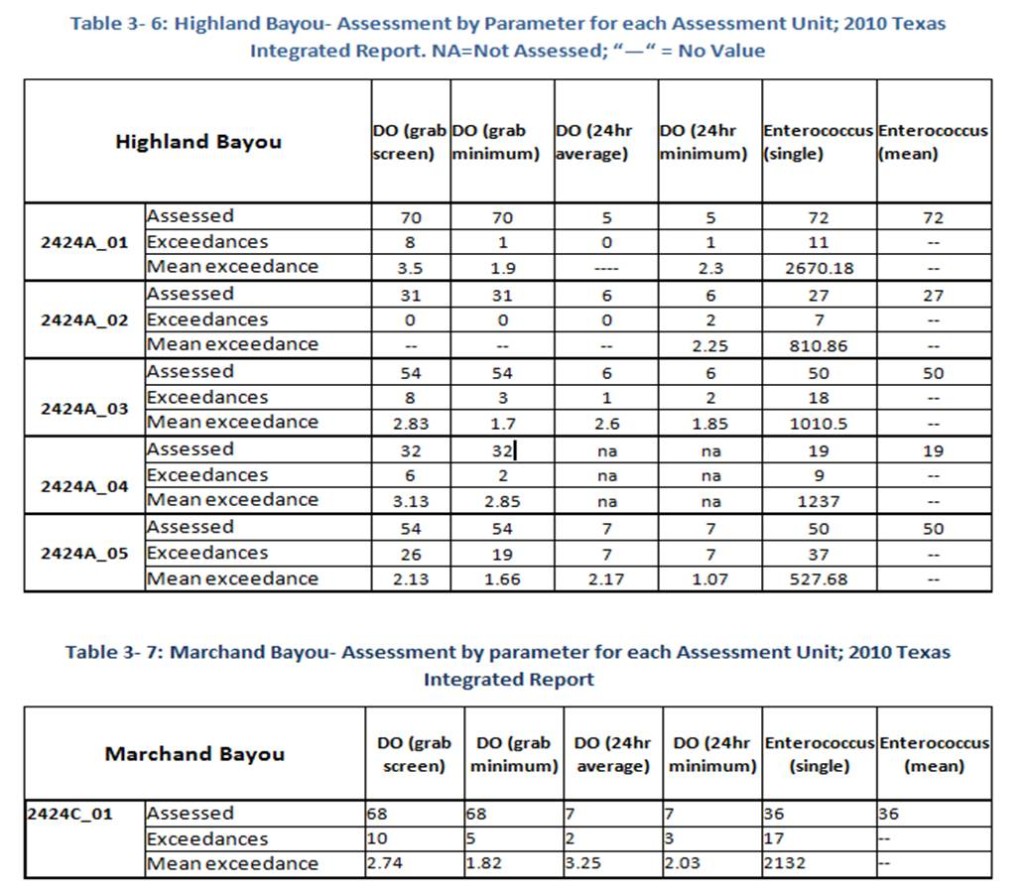
The following tables summarize the analyses done by TCEQ to warrant the 303d listing of Highland and Marchand Bayous in the 2010 Texas Integrated Report. ‘Assessed’ refers to the number of samples assessed. The tables indicate significant number of exceedences for bacteria, in particular Enterococcus, which is the bacteria indicator for saltwater. The inland segments generally have more exceedences than those downstream towards Jones Bay.

Summary
The following is a brief description of the results of a water quality analysis conducted by the Highland Bayou team. The analysis included 10 years of water quality data for 23 monitoring stations in the study area. All data between 2000 and 2010 from the stations were summarized for all years and by each of the four seasons.
Bacteria figures are very high, with averages and mean values exceeding limits for primary contact recreation. The highest values tend to be in the spring and summer, although exceedances occur throughout the year. There is a clear trend to lower values going downstream. The lowest values for Highland Bayou are at its confluence with Jones Bay, Station 16488, although exceedences have been observed there as well. Warm water conditions and the slow flow of water are ideal conditions for bacteria to grow. Non-point source runoff from wildlife, pet waste, septic systems, and waste water treatments plants are the likely sources for bacteria in these waterways.
Dissolved Oxygen values are highly variable, with lower values in the headwaters and higher values downstream at its confluence with Jones Bay. Higher values are shown for the months including and between November and February. The lowest values were measured in the summer months. Average values indicate overall values in line with limits set forth by the designated use for the bayou at 4mg dissolved oxygen per liter. Yet, the figures indicate that there may be numerous instances when values are below the limit.
Click here to access projects maps.


