Where is the study area located?
The study area encompasses the southern mainland area of Galveston County, including both incorporated and unincorporated communities. Incorporated communities include:
- Texas City
- La Marque
- Hitchcock
- Santa Fe
- Bayou Vista
- Village of Tiki Island
Population Trends
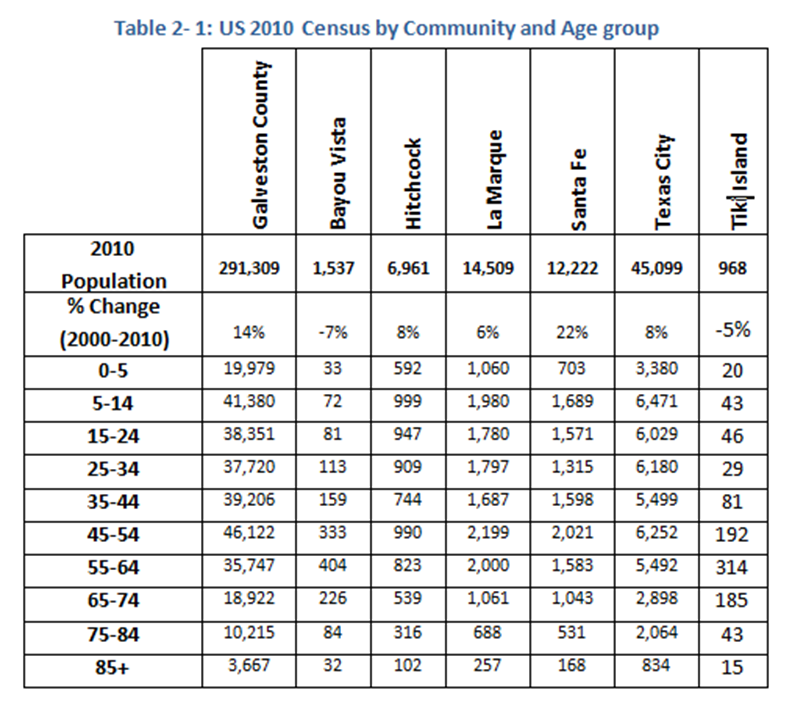
- The 2010 US Census indicates that Galveston County grew at a rate of 14% in the previous 10 years.
- The communities of Bayou Vista and Tiki Island lost population, -7% and -5% percent respectively. They experienced a population decline following Hurricane Ike in 2007.
- The remaining communities grew between 6% and 22%.
Population Forecasts
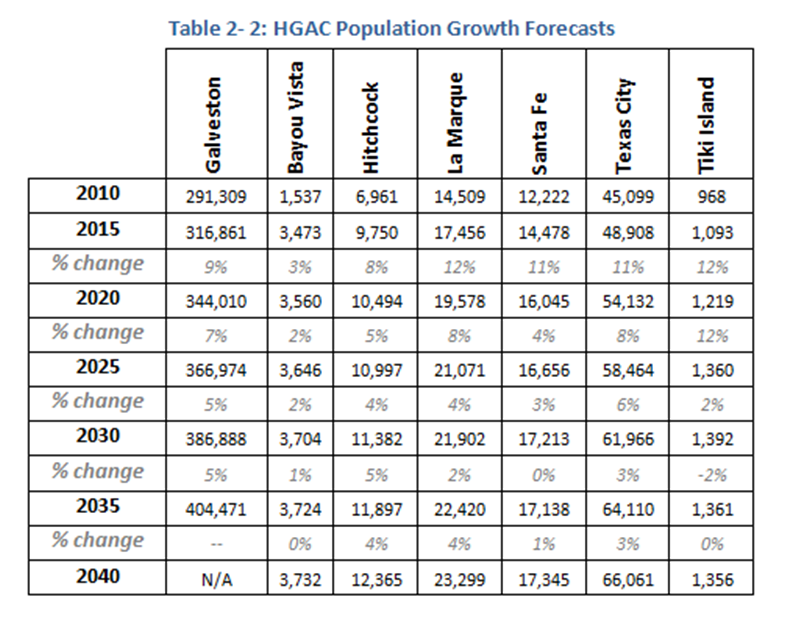
Communities in the watershed comprise part of the Houston-Galveston metropolitan area, sixth largest in the country. Forecast for regional growth is predicted to be strong. In the 30 years between 2005 and 2035, population in the Houston-Galveston area is expected to grow by 3.5 million residents, supporting an additional 1.5 million new jobs. Over 100,000 of those new residents will move into Galveston County. Population growth forecasts for communities in the study area range from 3% to 10% for each five-year period until 2035, resulting in a 30 year rate of growth of about 50%.
Population Growth Forecast 2005-2035
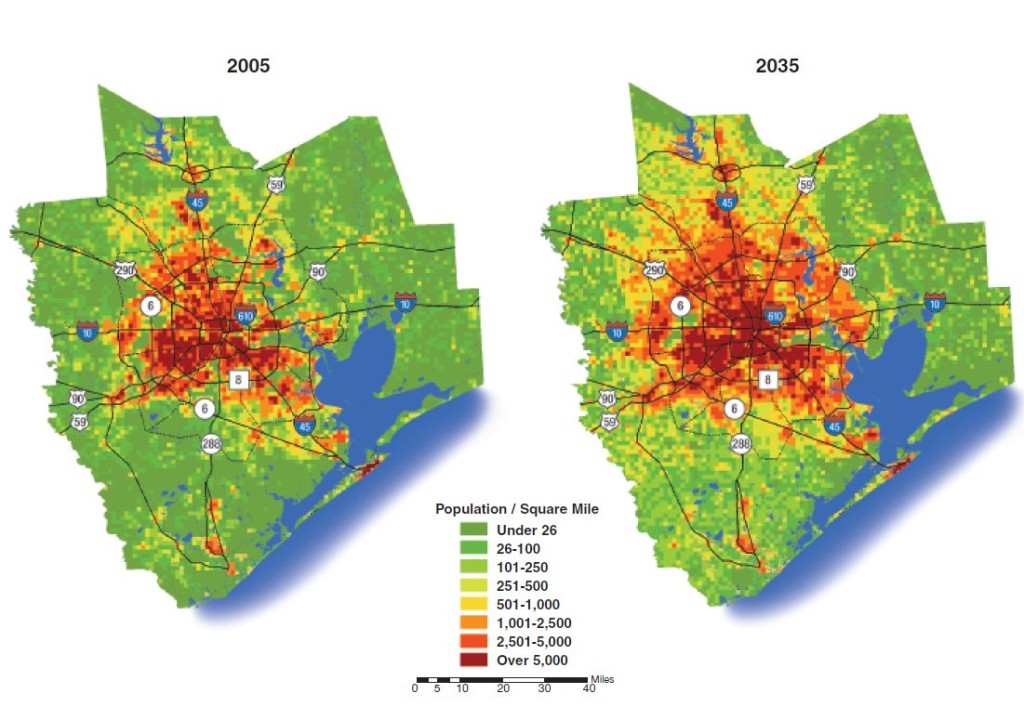
Map Credit: Houston-Galveston Area Council
The above map depicts, in absolute terms, growth results in population rising from just over 80,000 in 2010 residents to around 124,000 residents, an increase of approximately 44,000 residents in the study area.
Land Use/Land Cover
To better understand what land uses are occurring in the study area, C-CAP data was analyzed for the area. NOAA’s Coastal Change Analysis Program (C-CAP) is a remote sensing program designed to measure the type and extent of land coverage. The program provides inventories of standardized data for coastal communities. The data can be used to measure changes to land coverages and usages over time.

Each land coverage is assigned into general categories, such as development, agriculture, undeveloped vegetated areas, wetlands, and open water. These analyses indicate that land development is consuming more land as people move into the area. There is a corresponding decline in most other land use categories, such as agricultural lands and vegetated undeveloped lands. At this time, the analysis is unable to determine the path of land conversion, that is, where gains in one category came at a loss in another category. It is imaginable that pasture could be allowed to become vegetated as shrub or developed into homes. Likewise, there will be shifts within categories, such as conversion of land from low to high intensity development.
Land Use/Land Cover Summary for the Highland Bayou Subbasin (Only partial study area)
- 10-year increase of 154 acres in developed land
- Agricultural lands declined by 54 acres
- Undeveloped vegetated space declined by 25 acres
- Wetlands of all types declined by 82 acres
- Loss of 91 acres of open water potentially corresponds with the 94 acres gained as beach or unconsolidated land
- Approximately 47% of land in the basin is classified as developed

Land Use/Land Cover Summary for the Highland Bayou Coastal Basin (Entire Study Area)
- Approximately 770 acres were converted to developed land from agricultural or other non-intensive uses.
- Freshwater wetlands declined by nearly 200 acres, but estuarine wetlands increased by approximately 93 acres.
- Vegetated undeveloped areas saw a decline of 76 acres.

Why does this matter?
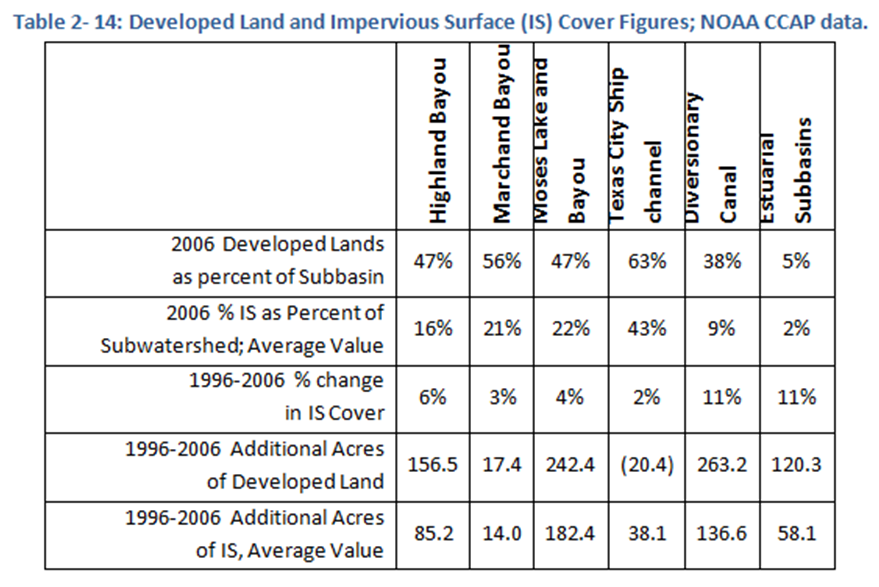
Impervious surfaces and land development are prime factors in loading rates for Nonpoint Source pollution. Increased levels of impervious surface result in less water infiltrating on the site and increases peak flow amounts and velocities above levels expected for undeveloped areas. Using CCAP data, estimates for impervious surface (IS) cover can be made for each subbasin. Ratios of impervious surface cover are defined for each NOAA CCAP land use classification. These values range from below 20% for ‘open space development’ to over 80% for ‘high intensity development. The table below summarizes trends for development and impervious surface cover for each subbasin in the study area.
Relationship Between Imperviousness and Water Quality
There are many factors that relate to the impact of impervious surface cover on watershed health—factors such as IS connectivity and runoff detention times—however, raw impervious surface (IS) percentages can provide a useful metric for assessing water quality conditions. The chart below illustrates the generalized relationship between impervious surface cover and stream health.

Based on estimates of impervious surface cover for each subbasin, bayous and waterways within the Highland (16% IS), Marchand (21% IS), and Moses Lake (22% IS) subbasins should have ‘impacted’ aquatic health. The Texas City Ship Channel (43% IS) falls in a classification of ‘degraded’ water quality and health. Not all development has an equal impact on waterways, and development densities and BMPs can mitigate the impact of NPS loading rates in the subbasins.
Click here to access the projects maps that illustrate the information above.