Rapidly increasing input prices were a major concern in the 2022 crop year. What do input prices look like as we approach 2023’s planting season? Updated AgriLife Crop & Livestock Budgets, as well as some updated decision tools can help you make this year’s production decisions.
Board Update 1/17/2023

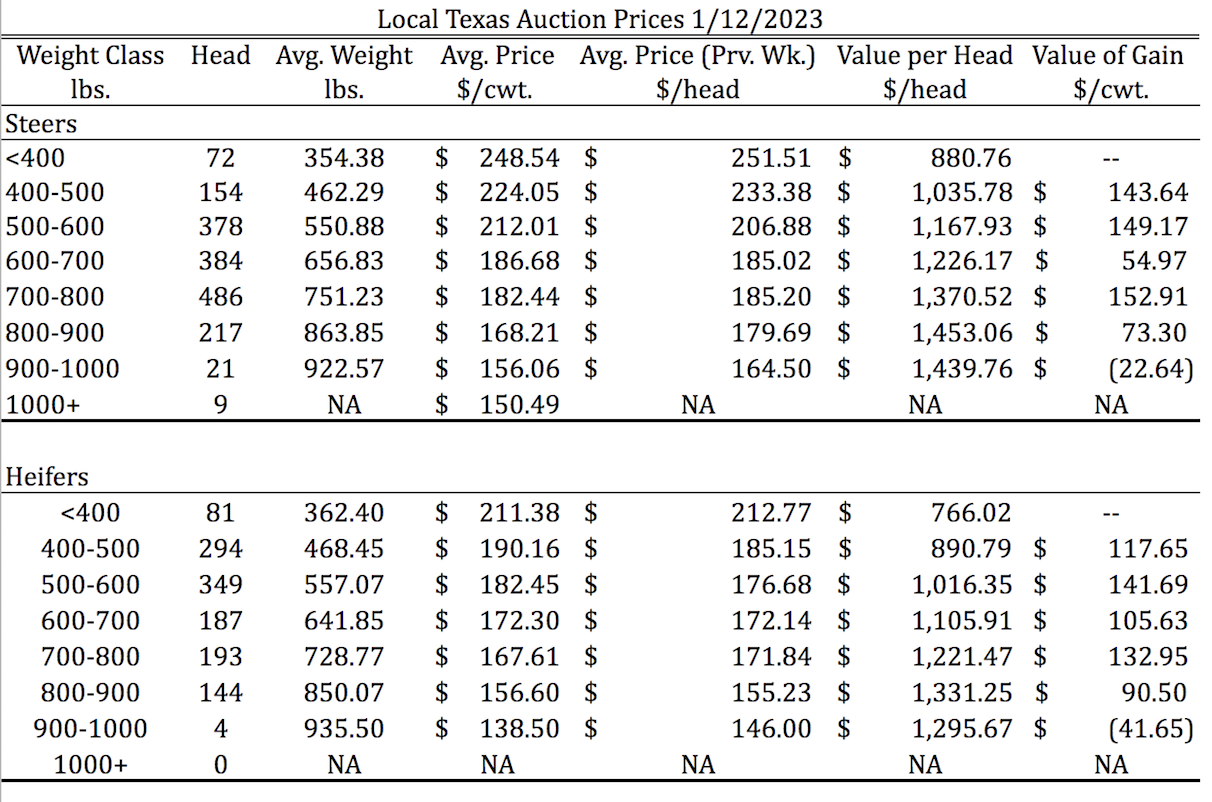
Tulia, Amarillo, Dalhart Average – Cattle Prices by Category 1/1/2023

Dates & Deadlines
1/17/2023 – Pioneer Spring Crop Meeting, Hereford
1/17/2023 – Moore County Ag Meeting on Rebuilding the Herd, Dumas
1/18/2023 – Southeast Panhandle Ag Conference, Clarendon
1/18-19/2023 – Red River Crops Conference, Childress
1/19/2023 – Pioneer Spring Crop Meeting, Plainview
1/19/2023 – Texas Alliance for Water Conservation Annual Water College, Lubbock
1/19/2023 – Northwest Panhandle Crop Conference, Stratford
01/24/2023 – 03/09/2023 – Master Marketer, Vernon
1/24/2023 – Crop Profitability Conference, Perryton
1/25/2023 – Top of Texas Cotton Conference, Pampa
1/25/2023 – Randall County Pre Plant Meeting, Canyon
1/26/2023 – Northwest Panhandle Ag Conference, Dalhart
1/27/2023 – High Plains Cotton Conference, Spearman
What We’re Reading
Uncertainty in input prices likely to continue in 2023 – Southwest Farm Press
Record low hay stocks this winter – Southwest Farm Press
Economists in WSJ Survey Still See Recession This Year Despite Easing Inflation – WSJ
Heifers on feed indicate long-term liquidation still occurring – Beef
Report reveals steady food behaviors through economic change – Morning Ag Clips
AgriLife Budgets & Decision Tools
The Texas A&M AgriLife Extension Crop & Livestock Budgets represent the Department of Agricultural Economic’s best forecasts of input costs, commodity prices, and fixed costs as of January 2023. Each Texas A&M AgriLife Extension District has its own set of budgets, with each template representing an ‘average’ farm or ranch for the region. A variety of crops and livestock enterprises are represented including corn, irrigated and dryland wheat, irrigated and dryland sorghum, irrigated and dryland cotton, as well as cow-calf and stocker enterprises.
The Budgets for District 1 are up-to-date and available in spreadsheet form at amarillo.tamu.edu under 2023 Crop Profitability Analyzer. The profitability analyzer is pre-loaded with the 2023 budget costs and prices, but provides the flexibility of updating both to match each producer’s production expectations. Free PDF versions of the 2023 budgets will be posted here in the next week. There will also be bound hardcover versions of these budgets for sale. If you would like a copy of these budgets and price trends, historic yields, and other data please contact Lacrecia Garza at lacrecia.garza@ag.tamu.edu or 806.677.5625.
Additionally, the 2023 Wheat Harvest Analyzer is available for use. The Wheat Harvest Analyzer is intended to help producers consider their wheat production choices as we approach harvest. The Analyzer will help producers estimate and compare their expected outcomes for grain harvest, wheat harvest, grazing, and silage for both irrigated and dryland wheat.
Input Costs in the 2023 AgriLife Extension Budgets for District 1
A key set of details covered in the AgriLife Extension Budgets for each district are the expectations for input costs through the upcoming crop year. Though costs may vary from producer to producer and are highly dependent on the production model, certain trends hold across the board. For the major row crops in the region (corn, sorghum, cotton, and wheat) a key set of inputs represent the majority of input costs. When combined, fertilizer, various energy expenditures, chemical costs, and custom operations represent as much as 63% of total costs over the last decade, depending on the crop. The categories may shift in importance depending on production model (irrigated vs. dryland). You might conduct your own fieldwork rather than hiring out to custom operators, though the expenses that accrue to custom operators still wind up on your plate. Either way, it is important for us to understand what the costs of each category are doing year to year.
Change in Fertilizer Preseason Budgeted Cost YOY

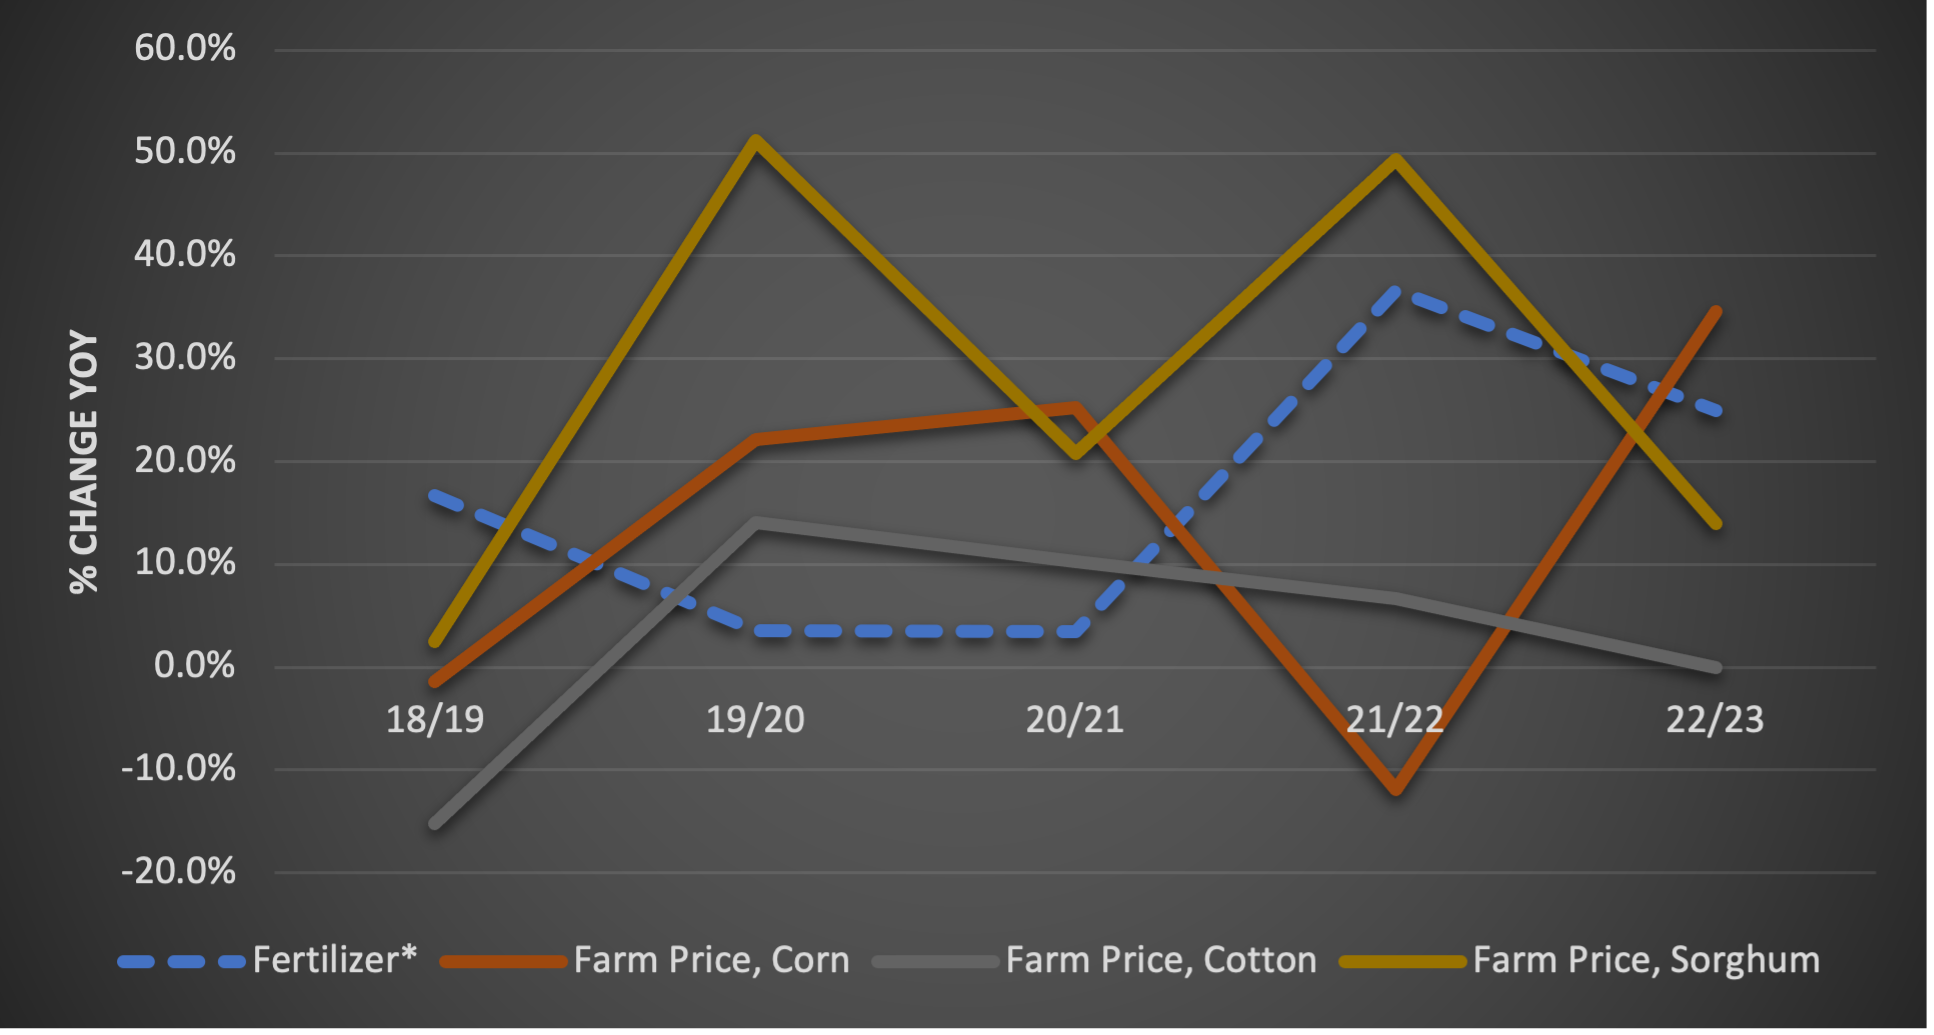
Fertilizer was probably the most talked about input cost through 2022, and the category on its own represents 12% to 22% of irrigated production expenses depending on the crop. We saw rapid changes in the cost of different nutrients from 2021 to 2022, with all fertilizer costs up nearly 40% at the time of last year’s budget publication. However through different parts of 2022 some fertilizer costs literally doubled over 2021. Supply chain issues that were only compounded by Russia’s invasion of Ukraine were significant drivers in that marketplace. Thankfully for producers, the rate of fertilizer price increase slowed from 2022 to the beginning of 2023, however prices are still up. The PPI measured an estimated increase in prices of roughly 25% for N and roughly 2% for P year over year.
Change in Energy Preseason Budgeted Cost YOY

In reality, the cost of energy is a significant driver of the cost increases seen in other categories. However, we focus on the on-farm energy expense in these examples. While diesel and gasoline prices are lower, and forecast to remain lower than last year’s budgeted costs per unit, the main cost of energy in irrigated production is natural gas. Though natural gas prices have fallen from 2022 mid-year highs, the cost per BTU is still higher than a year ago. At the time of budget publication in 2022 the cost of natural gas was forecast at roughly $3.91/MMBtu, where one MMBtu is roughly the energy needed to irrigate an acre-inch. However the annual average price eventually rose to $6.45/MMBtu and for a brief time price eclipsed $10.00/MMBtu. This year, when accounting for basis and irrigation timing against the Energy Information Administration forecast, the estimated cost of natural gas for 2023 is forecast at $4.70/MMBtu (or roughly $4.70/acre-inch).
Change in Chemical Preseason Budgeted Cost YOY

One of the more difficult inputs to track in terms of price paid is chemical expense. The variety of chemicals, delivery systems, and the availability of each under different brand names make forecast of the total category relatively more complex. USDA’s measure of chemical expense in the PPI for 2023 forecasts an increase in the cost of chemical of roughly 40% year over year. This is certainly still a significant increase, though at a moderately slower rate than in 2022.
Change in Custom Rates Preseason Budgeted Cost YOY

The final category that represents significant expense, though in many cases the lowest of the big four, is custom operations. You can also consider this as a proxy for in-house field operations as the components are the same (labor and fuel). This category is a rare one (along with seed) in which we saw little increase in expense and in certain field operations actually saw a decline in costs. These lower prices are largely a function of lower diesel and gasoline prices in the upcoming year.

[…] On the cost side, the budgets project that operating costs for cotton will increase in 2023. For an in-depth explanation for why input costs might increase this year, check out last week’s post. […]