2026/27 Wheat Grain vs. Grazing

This is the time of year when we can start analyzing what’s best for our wheat fields. So far, most wheat fields look very good in our area, and with an El Niño weather pattern, we hope we can finally have good yields and grazing this year.
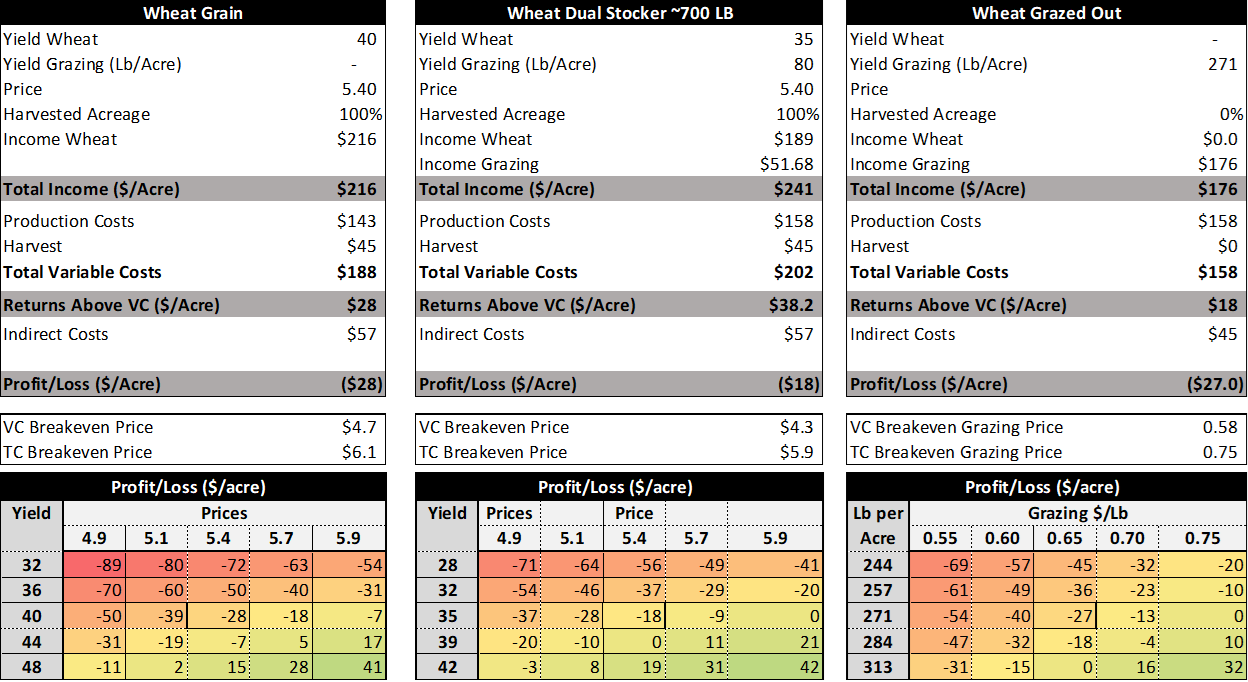
Once again this year, wheat prices in our Texas region are below the breakeven price for dryland wheat considering normal yields. In this example, the breakeven price is $6.1 per bushel, or $0.75 per pound if you graze out all your wheat.
Today, we’ll use one of our tools to look at whether grain, grazing, or both might be the better choice, depending on current wheat and grazing prices.
For this analysis, we’ll use the “Wheat and Small Grain Decision Aids” Excel spreadsheet to compare the options. This tool supports economic and financial decision-making. You can download it from our District 3 website (https://vernon.tamu.edu/extension-projects/d3-agricultural-economics/).
This tool lets you compare different systems, like grazing until March 1, grazing out the whole field, and more. For today’s example, we’ll look at three options: wheat for grain, grazing until March 1 (Wheat Dual Stockers ~700 lb), and graze out (Wheat Graze Out).
We’ll use production costs from the District 3 Enterprise Budgets. These are average costs to give you a general idea. I suggest using the Excel spreadsheet yourself later and adjusting the numbers to match your own costs, yields, beef production, and prices for a more accurate analysis.
Wheat Grain Harvest, Wheat Dual Purpose, vs. Wheat Grazed Out
This year, grazing until March 1 and then harvesting looks like the best economic option. In this example, grazing income makes up for a lower yield of 5 bushels per acre. This assumes you have water, fences, enough forage, and enough animals to get the most beef production. The breakeven price for wheat harvest is $6.1 per bushel, which covers all expenses (depreciation, interest, etc.) (Table 1). This is higher than the estimated future harvest price for our area, which we assumed to be $5.4 per acre. The breakeven grazing price is $0.75 per pound, just above the assumed price of $0.65 per pound in this example.
Table 1. Wheat Grain vs Wheat Grazed Out Profitability
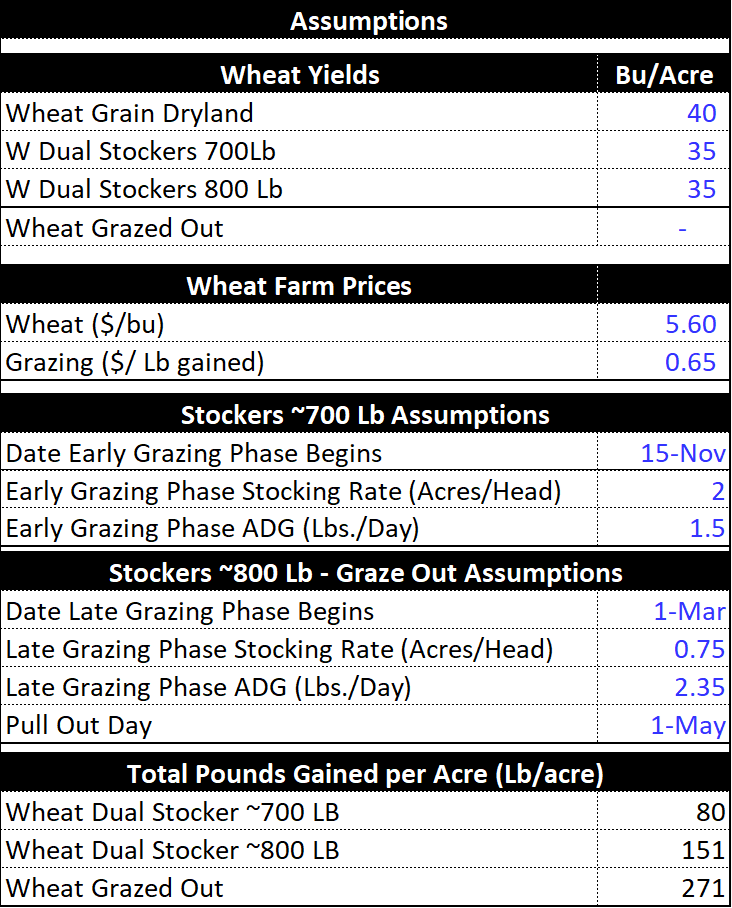
In this example, we used a grazing period from November 15 to May 1. We assumed an average daily gain of 1.5 pounds per head until March 1, and 2.5 pounds per head until May. For wheat harvest, we used a yield of 40 bushels per acre. It’s important to use your own production numbers that match your field conditions and your expectations for beef and wheat yield. The Wheat Dual Stocker option also assumes a yield loss of 5 bushels per acre. Even with this lower yield, this option gives better returns.
Table 2. Assumptions
You can also use the decision aid to compare these options from both an economic (Table 1) and financial (Table 3) perspective. It helps you see which choice is better for your cash flow. You can also look at the numbers if you have your own harvester.
Table 3. Wheat Grain vs. Wheat Grazed Out Cash Comparison

The Wheat and Small Grain Decision Aid is a tool to help farmers make economic and financial decisions. It’s important to use your own data, yield expectations, and costs to get the best analysis for your situation. The examples here are based on current wheat conditions and expectations.