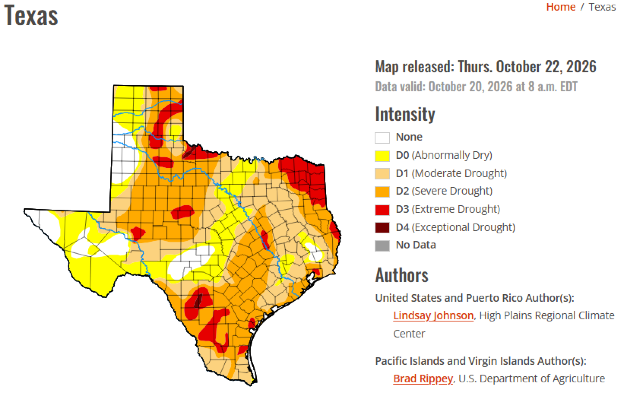
In recent years, drought has become a common occurrence in Texas. Currently, the U.S. Drought Monitor reports that approximately 90.5% of Texas is experiencing some level of drought as of October 22, 2026 (Figure 1). Producers are increasingly adopting the USDA’s Pasture, Rangeland, and Forage Insurance Program (PRF), recognizing its important role in supporting ranchers during these challenging conditions. In 2024, Texas enrolled 42.8 million acres in the program, a 191% increase from 2011.
One of the most attractive features of this program is its potential to generate positive net benefits, with indemnity payments exceeding premium costs in many cases. More importantly, it provides significant support during the years when producers need it most.
Pasture, Rangeland, and Forage Insurance Program Review
The enrollment deadline for the USDA’s Pasture, Rangeland, and Forage Insurance Program (PRF) is December 1. Commonly referred to as rainfall insurance, the program was developed to reduce the economic impacts of inadequate rainfall. It provides insurance coverage for grazing pasture, rangeland, and forage acres, whether irrigated or non-irrigated.
How Does It Work?
The program does not directly measure drought severity or forage losses. Instead, it measures precipitation levels relative to the historical average for a specific area. The National Oceanic and Atmospheric Administration (NOAA) developed a rainfall index that tracks precipitation within designated geographic grids. Indemnities are triggered when actual rainfall falls below the historical average for that grid.
PRF Example
As we do each year, we will use an example to illustrate the benefits of this program. For this example, we will use the USDA support tool (https://public-rma.fpac.usda.gov/apps/PRF) to estimate premium costs, evaluate coverage options, and review historical results dating back to 1948.
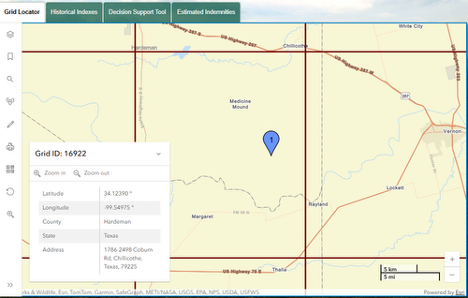
This year, we will use a 1,000-acre operation located near our Research Center farm in Hardeman County (Grid ID: 16922; Image 1).
First, after selecting the farm location, we choose the intended use of the insured acres (grazing or haying), production practices (irrigated, organic, etc.), and the coverage level (70%, 75%, 80%, 85%, or 90%). For this example, we will use the default coverage level of 90% and a productivity factor of 100%. However, producers can adjust the productivity factor to better reflect the productivity of their operation.
We also need to select a sample year. Since 2026 has not yet ended, we cannot use it as an example. Instead, we will use results from 2025, a year marked by drought conditions.
Second, we must decide how to allocate insurance coverage across the year using bi-monthly intervals. There are several allocation strategies available, and producers should discuss these options with their insurance agent. In this example, we will use one of the most common approaches by distributing coverage evenly throughout the year.
In previous examples, we have also highlighted strategies that concentrate coverage during periods when forage production is most critical. The even-allocation strategy generally produces a greater number of smaller indemnity payments. In contrast, concentrating coverage during key forage production periods typically results in fewer payments, but larger indemnities during summer droughts when forage losses have the greatest economic impact.
For this example, coverage is allocated evenly across all six intervals:
- January-February: 16.66%
- March-April: 16.66%
- May-June: 16.67%
- July-August: 16.67%
- September-October: 16.67%
- November-December: 16.67%
The selected percentages must total 100% (Table 1).
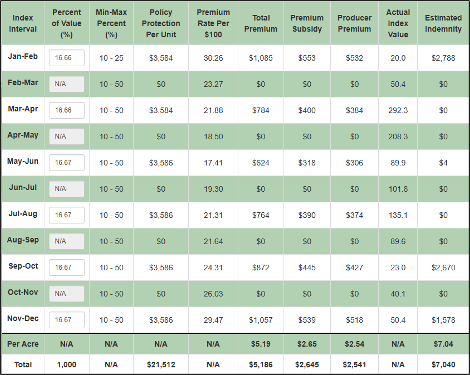
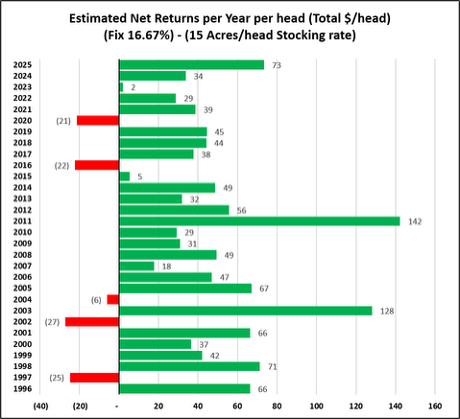
The tool generates results for the selected sample year of 2025. In this example, the producer premium was $2.54 per acre. The estimated indemnity payment was $7.04 per acre, resulting in a net gain of $4.50 per acre. Assuming a stocking rate of 15 acres per cow, the net payment equates to $67.50 per cow.
Historical Estimated Indemnities and Net Results
One of the most valuable features of the USDA support tool is its ability to estimate historical results. Producers can review how the insurance would have performed as far back as 1948.
For example, over the last 30 years, this coverage scenario would have generated an average net payment of $2.53 per acre above premium costs (Table 2). Assuming a stocking rate of 15 acres per cow, the average net indemnity received would have been approximately $37.95 per head.
Indemnity payments exceeded premium costs in 25 of the 30 years evaluated. More notably, in this example, the producer never paid the full premium because of federal premium subsidies.
The largest estimated net payments occurred in 2025, 2011, 2003, 1998, and 1996. Net payments during those years ranged from approximately $66 to $142 per head.
The Pasture, Rangeland, and Forage Insurance Program (PRF) is an effective risk-management tool for producers facing below-average rainfall. Most importantly, it helps ranchers offset increased feeding expenses and other drought-related costs when precipitation falls short of normal levels.
For more information about PRF, consult the USDA Fact Sheet for the Pasture, Rangeland, and Forage Insurance Program. If you are considering purchasing coverage, a list of approved agents and insurance companies is available through the USDA Risk Management Agency’s Agent Locator tool (https://www.rma.usda.gov/tools-reports/agent-locator).