 June is National Dairy Month, so today we’re talking about all things dairy. In this post, we’ll look at the U.S. dairy industry by the numbers, how the U.S. likes to consume its dairy products, and how the U.S. dairy industry contributes to global dairy production and consumption.
Board Update 6/20/2023

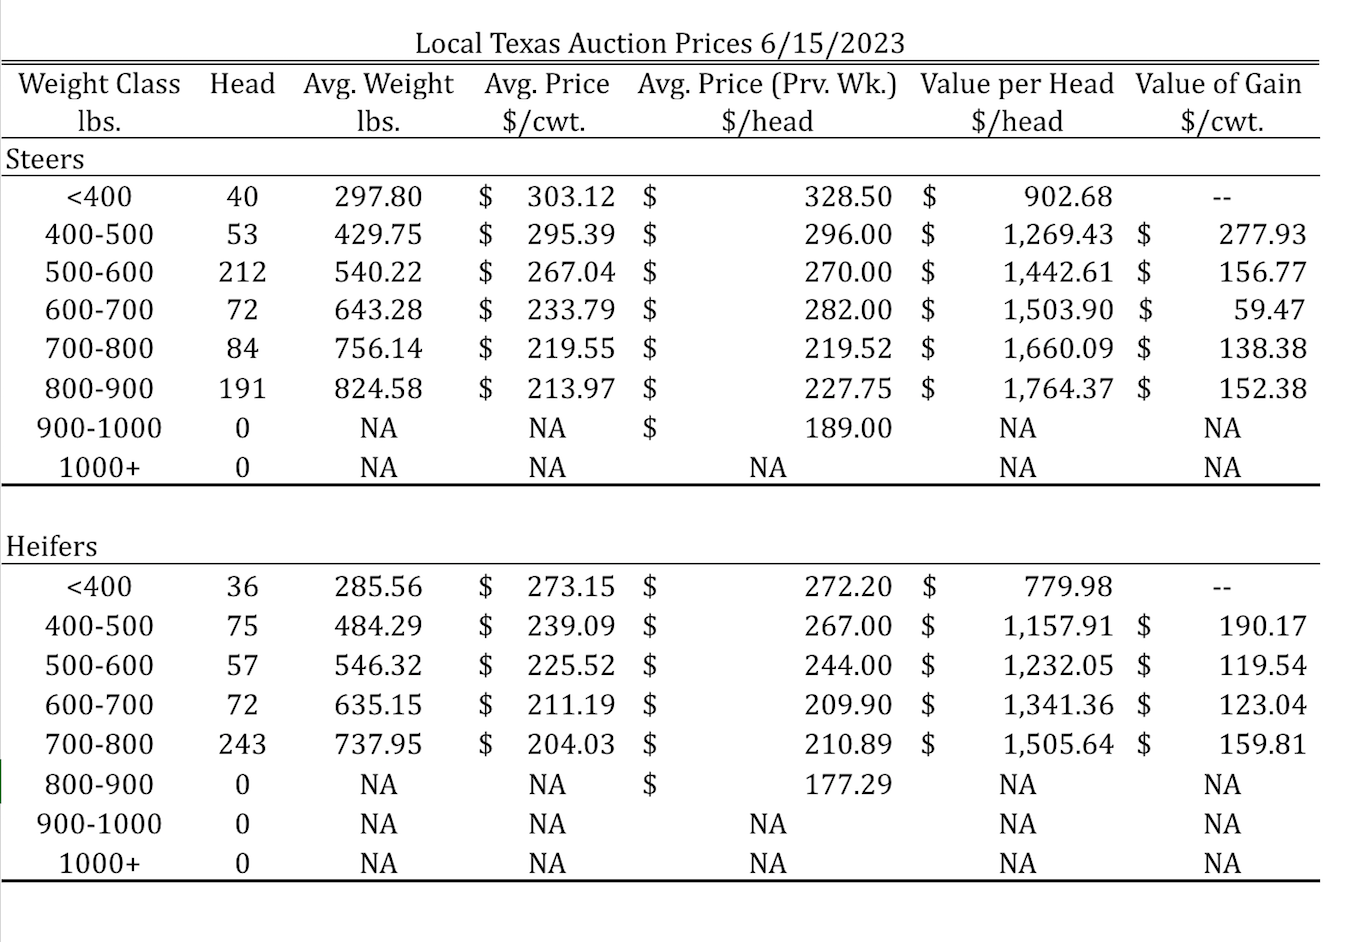
Tulia, Amarillo, Dalhart Average – Cattle Prices by Category 6/15/2023

Dates & Deadlines
6/28/2023 – 2023 Angora Goat Testing – Final Weigh Day and Shearing
7/6/2023 – Ranchland Friend or Foe?
8/1 -8/2/2023 – Amarillo, Texas – 2023 Grain Grading Workshop
8/7-8/9/2023 – College Station, Texas – Beef Cattle Short Course
8/18-8/19/2023 – San Angelo, Texas – Texas Sheep and Goat Expo
8/25/2023 – Fire Field Day – San Angelo, Texas
The U.S. Dairy Industry by the Numbers
Let’s start by looking at some numbers for the dairy industry in the U.S. and in Texas. Figures 1 and 2 illustrate milk production over the last two decades in the United States according to USDA ERS dairy data. Figure 1 shows the change in total milk production from 2000 to 2022. In 2022, the United States produced 226,620 million pounds of milk, which is equivalent to 26,351 million gallons.

Figure 2 shows the average number of dairy cows in the United States in each year from 2000 to 2022 and the amount of milk produced per cow. During this period, the average number of milk cows in the U.S. ranged from a low of about 9 million head in 2004 to a high of almost 9.45 million head in 2021. Over this same period, the milk produced per cow increased from 17,763 pounds (about 2,065.5 gallons) in the year 2000 to 24,097 pounds (about 2,802 gallons) last year.

Over this same period, the dairy industry in Texas has grown tremendously, according to USDA ERS data. In the year 2000, the State of Texas ranked sixth both in number of dairy cows and in amount of milk produced with about 348,000 dairy cows and 5,743 million pounds of milk produced. By 2022, these numbers increased to 646,000 cows and 16,524 million pounds of milk. Texas is currently the fourth largest state both in terms of dairy cows and in terms of milk production.
Dairy Consumption in the United States
Figure 3 below compares U.S. per capita consumption of different types of dairy products in 2021 as reported by USDA ERS. That year, U.S. consumers drank about 134 pounds of milk on average, which accounted for just under 60% of total dairy consumption. The next largest categories of per capita dairy consumption were cheese and ice cream. In 2021, U.S. consumer ate on average 40.3 pounds of cheese and 18.4 pounds of ice cream.

How dairy is consumed in the U.S. has changed over time. According to USDA ERS, in the year 2000 the average U.S. consumer drank about 196 pounds of fluid milk, which is about 23 gallons. In 2021, this figure had decreased to 134 pounds, or 15.6 gallons. Consumption of cheese and butter, on the other hand, both increased. Per capita cheese consumption increased by about 8 pounds from between the years 2000 and 2021, and per capita butter consumption increased by about 2 pounds per person.
The U.S. Dairy Industry in the Global Market
In terms of the global market, the United States is both a major producer and exporter of dairy products. According to the latest USDA Foreign Agricultural Service (FAS) World Markets and Trade report for dairy, the United States maintained the fourth largest dairy herd in the world from 2018-2022 and was the second largest producer of fluid milk during this period.
USDA FAS estimates U.S. dairy exports in 2022 at 3 million metric tons with a value of $9.51 billion. The top markets for U.S. dairy exports in 2022 were Mexico, Canada, and China. Mexico was the largest export market for U.S. dairy products with exports valued at $2.44 billion, which is more than double the value of exports to Canada and is triple the value of exports to China.
Food for Thought
If you’re looking for some fun facts or ideas to help you celebrate National Dairy Month, I recommend this article from the American Farm Bureau Foundation for Agriculture:
If you’re interested in statistics about the U.S. dairy industry, I recommend these sites from the U.S. Census Bureau and USDA ERS:
National Dairy Month: June 2023 (U.S. Census)
Dairy Overview (USDA ERS