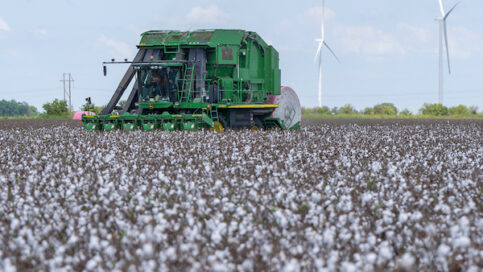
Cotton picker on Tuesday, Sep 17, 2024, in El Campo, Texas. (Michael Miller/Texas A&M AgriLife)
The USDA released its May World Agricultural Supply and Demand Estimates on Monday. The May report is significant because it provides our first look at the USDA’s expectations for the upcoming marketing year. Today, we discuss what the report indicates about the 2025/26 season.
Wheat
Table 1 presents the balance sheet for all wheat production and use in the United States. The report indicates that the U.S. will plant approximately 700,000 fewer acres in 2025/26 than in the previous marketing year and will produce about 50 million fewer bushels of wheat. However, the USDA Crop Production Report, also released on Monday, estimates that winter wheat production in 2025 will increase by 32.7 million bushels compared to 2024. Despite lower production for all wheat, the WASE report projects that supply for 2025/26 will increase by 64 million bushels because larger beginning stocks more than offset production. Finally, fewer exports, combined with similar domestic use compared to 2024/25, lead to a year-over-year increase in ending stocks of 82 million bushels.
Table 2 summarizes the balance sheet for world wheat production and use. If China is included, the report expects world ending stocks to remain relatively unchanged compared to the 2024/25 marketing year. If China is excluded, the report indicates that ending stocks will increase by approximately 3.5 million metric tons (MMT). Finally, the report predicts that Russia will lead world wheat exports, followed by the European Union and Canada, as in previous marketing years.

Table 1. United States Wheat Supply and Demand Source: USDA World Agriculture Supply and Demand Estimates, May 12, 2025

Table 2. World Wheat Supply and Demand Source: USDA World Agriculture Supply and Demand Estimates, May 12, 2025
Corn and Sorghum
Tables 3 and 4 report the projected United States balance sheet for corn and sorghum, respectively. The report anticipates increased planted acres, production, and crop supplies. It also expects corn use to rise, driven by greater domestic use and exports. However, the increase in use does not fully offset the increase in supplies. Corn ending stocks indicate a significant year-over-year growth, reaching their highest level since the 2019/20 marketing year. Regarding sorghum, the report predicts an increase in use, a shift from domestic use to exports, and a year-over-year decrease in ending stocks.
In terms of world corn production and use, the report projects a 29 MMT reduction in beginning stocks, more than offset by a 44 MMT increase in production, as shown in Table 5. When China is factored in, world use increases by 24 MMT, and world ending stocks decrease by 9.5 MMT. Without China, world use would increase by 19 MMT, and ending stocks would increase by 6.6 MMT. The report expects the United States to lead in exports in 2025/26, followed by Brazil and Argentina.
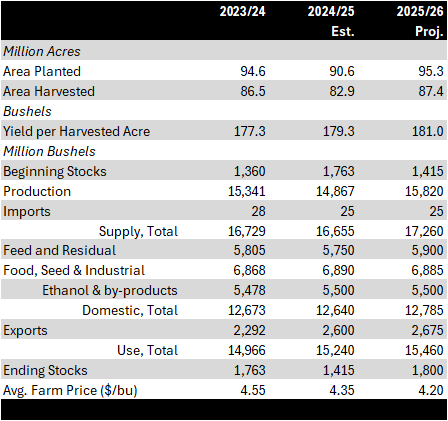
Table 3. United States Corn Supply and Demand Source: USDA World Agriculture Supply and Demand Estimates, May 12, 2025

Table 4. United States Sorghum Supply and Demand Source: USDA World Agriculture Supply and Demand Estimates, May 12, 2025

Table 5. World Corn Supply and Demand Source: USDA World Agriculture Supply and Demand Estimates, May 12, 2025
Cotton
Table 6 presents the projected balance sheet for United States cotton. The USDA projections indicate production levels similar to those of the 2024/25 marketing year, along with reduced planted acres. This projection assumes cotton abandonment consistent with the 10-year average; however, the U.S. crop has seen above-average abandonment in recent years. If the USDA prediction holds, U.S. cotton supplies will rise by 10% year-over-year. On the use side of the balance sheet, the report forecasts a 1.4 million bale increase in use, driven by increased exports. Despite this, the report anticipates a 400,000-bale rise in ending stocks compared to 2024/25.
The USDA prediction for world cotton supply and use indicates a decrease in production compared to last year, accompanied by a slight increase in use (Table 7). This is offset by larger world beginning stocks in 2025, leading the report to anticipate minimal change in ending stocks, regardless of whether China is included in the figures. In terms of exports, the report forecasts that Brazil will lead cotton exports with 14 million bales, followed by the United States.
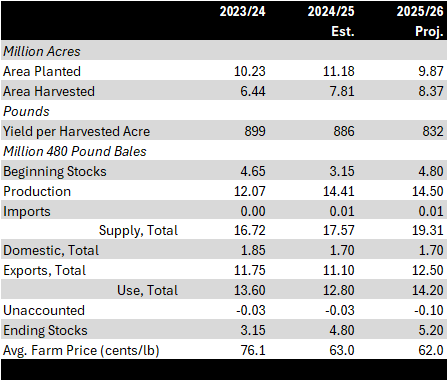
Table 6. United States Cotton Supply and Demand Source: USDA World Agriculture Supply and Demand Estimates, May 12, 2025
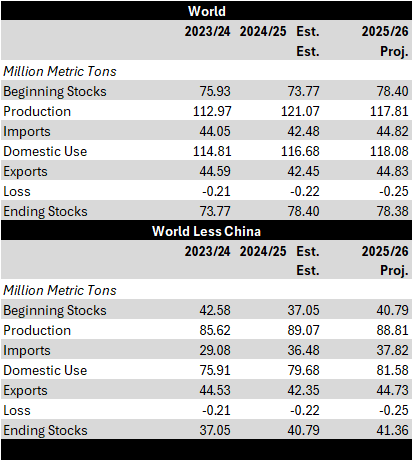
Table 7. World Cotton Supply and Demand Source: USDA World Agriculture Supply and Demand Estimates, May 12, 2025
Room for Uncertainty
Remember that the numbers reported in the May WASDE are estimates based on assumptions. One of these assumptions, noted at the beginning of the report, is that the WASDE only considers the impact of trade policies in effect at the time of publication. Furthermore, the report assumes that current trade policies will remain in place during the forecast period. This is a critical assumption because the United States’ trade policy and relationships are currently in flux. Any changes to our trade situation could significantly impact agricultural exports. A second critical assumption in the May report is that the USDA Prospective Plantings Report accurately estimates actual planted acres. Additionally, the report assumes that harvested acres and yields are near their 10-year averages. We’ll know more about planted acres at the end of next month when the USDA releases its Acreage Report. Harvested acres and yields will depend mainly on summer weather conditions.