 Projected crop insurance prices for counties in AgriLife Extension Districts 1 and 2 were set in February. Today, we consider what these prices imply about the financial risk that producers face in 2025.
Projected Insurance Prices and Revenue Guarantees
The projected price discovery period for corn, sorghum, and cotton planted in the Texas Panhandle and South Plains runs from February 1 until February 28. Now that we know these prices, we can estimate the revenue guarantees for these crops in 2025.
Table 1 (at the end of the post) shows the 2025 projected insurance prices and revenue guarantees for irrigated and dryland corn, sorghum, and cotton in AgriLife Extension District 1, and compares them to the same values in 2024. Table 2 presents the same information for District 2. In a crop insurance policy, the revenue guarantee is calculated as:
Actual Production History (APH) Yield × Insurance Price × Coverage Level.
In Tables 1 and 2, I assume a 70% coverage level and use the yields from the 2024 and 2025 AgriLife Extension enterprise budgets as the APH yield. I also convert the budgeted sorghum yields from hundredweight to bushels to match the insurance price per unit.
In both districts, corn and sorghum coverage increase slightly in 2025 because of a higher insurance price. However, cotton coverage decreases significantly. The projected cotton price decreased by about 17% in 2025 compared to last year. So, even if the expected yield is the same, the revenue guarantee is 17% smaller.
Guaranteed Revenue vs. Projected Costs
How might a smaller revenue guarantee for a crop affect a producer’s financial risk? I answer that question by comparing each crop’s revenue guarantee in Tables 1 and 2 to their expected costs of production. In general, the smaller a crop’s revenue guarantee is relative to its costs, the greater the financial risk associated with its production. If the crop’s revenue falls below the policy’s guarantee, the unpaid portion of the producer’s cost is greater, and the producer’s losses increase. Therefore, if a crop’s revenue guarantee decreases relative to costs from one year to the next, we conclude that the crop’s financial risk has increased.
Table 3 compares the 2024 and 2025 revenue guarantees for corn, sorghum, and cotton to their variable and total costs estimated in the AgriLife Extension District 1 budgets. For corn and sorghum, the 2025 revenue guarantee covers the same percentage of costs as in 2024. The revenue guarantee for cotton covers a much smaller percentage of costs in 2025. Table 4 provides the same analysis for District 2 with the same results. Based on this analysis, the financial risk associated with producing corn and sorghum in 2025 is like that of 2024 in both districts. The financial risk associated with cotton production in both districts has increased.
Implications for Decision Making in 2025
It appears that cotton producers in 2025 will face increased risk this year due to cotton’s relatively low insurance price. In response, I suggest that producers discuss ways to enhance their coverage with their insurance agent. This could mean participating in yield enhancing options like Yield Exclusion or Yield Adjustment. Producers should also discuss the costs and benefits of shallow loss policies like STAX, SCO, and ECO with their agent. Keep in mind that the sales closing date for insurance decisions is March 15. If any producers haven’t started that conversation with their agent, it’s time to do so.
Finally, as producers consider what this information might mean for their planting and insurance decisions this year, I encourage them to consider two things. First, the analysis given here assumes costs and yields near to what we estimate in the AgriLife Extension crop budgets. A more efficient crop enterprise, with higher yields and lower costs, will face less financial risk at any insurance price or policy coverage level. A less efficient enterprise will face more financial risk. Second, as producers make insurance decisions, I suggest they attempt to answer three questions:
- How much risk can I tolerate?
- How much protection do I need?
- How much protection can I afford?
Greater insurance coverage always comes at a higher cost. Producers always need to balance their need for risk protection against its cost.
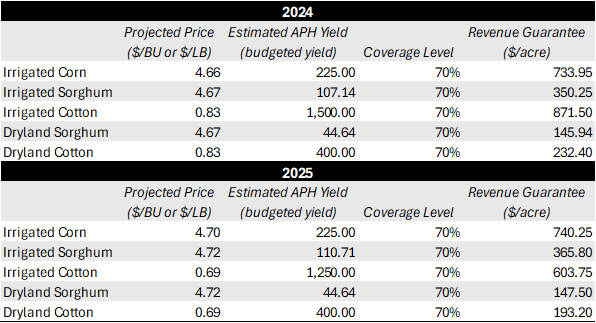
Table 1. Projected prices and estimated revenue guarantees based on District 1 budgets
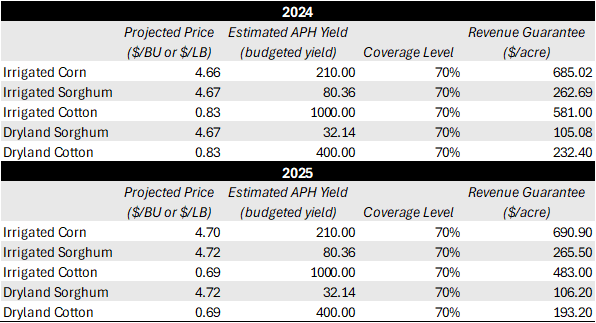
Table 2. Projected prices and estimated revenue guarantees based on District 2 budgets
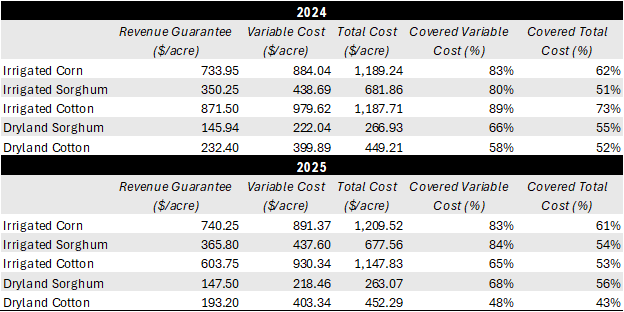
Table 3. Percent of District 1 budgeted costs covered by the estimated revenue guarantee
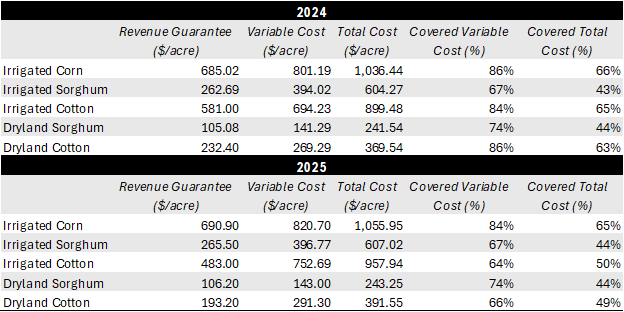
Table 4. Percent of District 2 budgeted costs covered by the estimated revenue guarantee