 Inflation continues to concern consumers, farmers, and policymakers. In this post, we discuss how inflation has impacted prices paid by farms for production inputs.
Common Inflation Metrics
Inflation describes a general increase in the price of goods and services in the economy. As our demand for goods and services increases, or as their cost of production increases, prices also increase. To measure inflation, economists usually calculate a price index. An index reports prices in one year as a percentage of the same prices in a different year. Most indexes specify a base year (or years) and every year in the index is compared to the base period. For example, in the Consumer Price Index (CPI), the base period is an average of prices from 1982-1984. The CPI value for February 2025 is 319.775. This means the CPI estimates prices today are about 320% higher than in the 1982-1984 base period.
There are numerous indexes available to measure inflation. Some popular indexes include the Consumer Price Index (CPI), the Personal Consumption Expenditures Index (PCE), and the Producer Price Index (PPI). The CPI and PCE measure the change in prices paid by U.S. consumers. The PCE is the Federal Reserve’s preferred inflation metric. The PPI measures changes in prices received by U.S. producers for their output.
There is also an index that focuses on inflation in farm production costs. Each year in March, the USDA National Agricultural Statistics Service surveys producers to calculate the Prices Paid Index. This index reports the prices for chemicals, fertilizer, machinery, feed, fuels, and retail seed relative to 2011 (the base year).
Changes in Prices Paid for Farm Inputs
How has inflation impacted farm input costs over time? Figure 1 illustrates the changes in the Prices Paid Index for all production items, and selected expenses, from 2015-2024. There are three things to highlight in these graphs. First, the index values don’t change much from 2015 until 2021. Then, in late 2021, price levels increased significantly, which coincided with the start of high inflation in the overall economy. Finally, price levels stopped increasing around July 2022, which is about the time that overall inflation began to fall.
Another way to look at this data is to consider the annual percentage change in the index values (the inflation rate). Figure 2 illustrates the inflation rate in the Prices Paid Index. For comparison, Figure 3 shows the inflation rate in the CPI. Overall, inflation in the Price Paid Index follows the same trend as the general economy. However, there is one important difference. Unlike the CPI, there are periods when the inflation rate in the Prices Paid Index is negative. During these periods, prices paid by farms decrease. While farm input costs follow the same general inflation trend as the broader economy, other forces are also at work in these markets to determine prices.
Some Parting Thoughts About Inflation
I want to leave readers with two thoughts about inflation. Price indexes tell us about average price levels. Indexes give us a sense of inflation for the entire United States. In some areas of the country, price levels have risen more than the CPI or Prices Paid Index indicates. In others, price levels have not increased as much.
I also want to point out the difference between a decrease in inflation and a decrease in prices. Normally, when someone says that inflation has decreased, they mean the inflation rate is less. In other words, prices are still increasing but not as quickly. Economists call this disinflation. For prices to fall, the inflation rate must decrease to the point that it is negative. For example, in Figure 3 the inflation rate for All Production Items is negative from January 2016 until September 2017. During this period, the Prices Paid Index fell from 107.1 to 103.9. Prices paid by farms in January 2016 were 107.1% of the base year price level. In September 2017, prices paid were only 103.9% of the base year price level. Economists call this deflation. Inflation has decreased over the last year and a half. However, it is also true that prices are significantly higher than they were at the end of 2020.
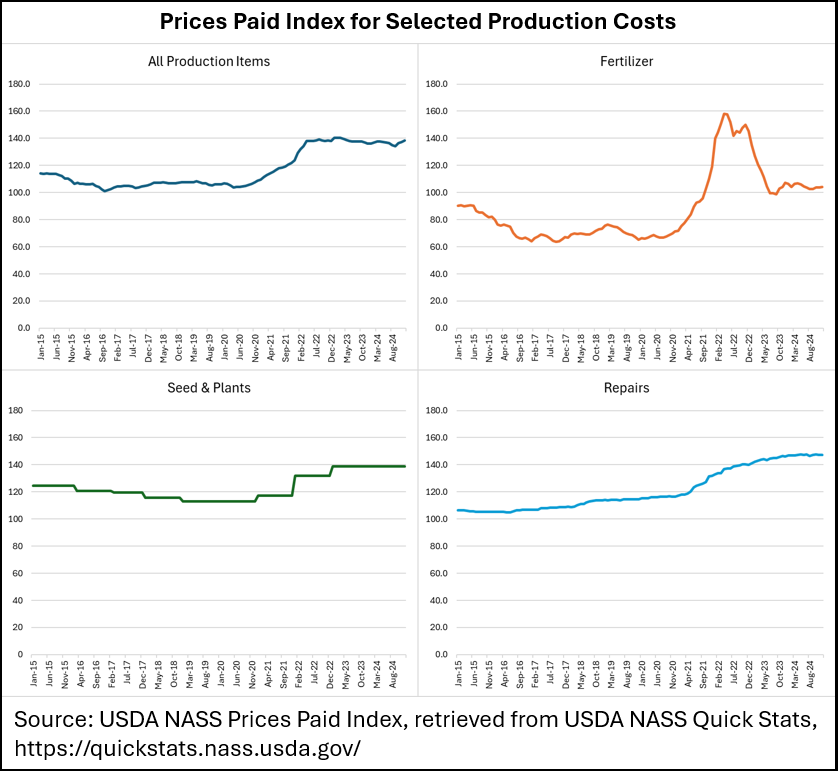
Figure 1. Prices Paid Index for Selected Production Costs, 2015-2024
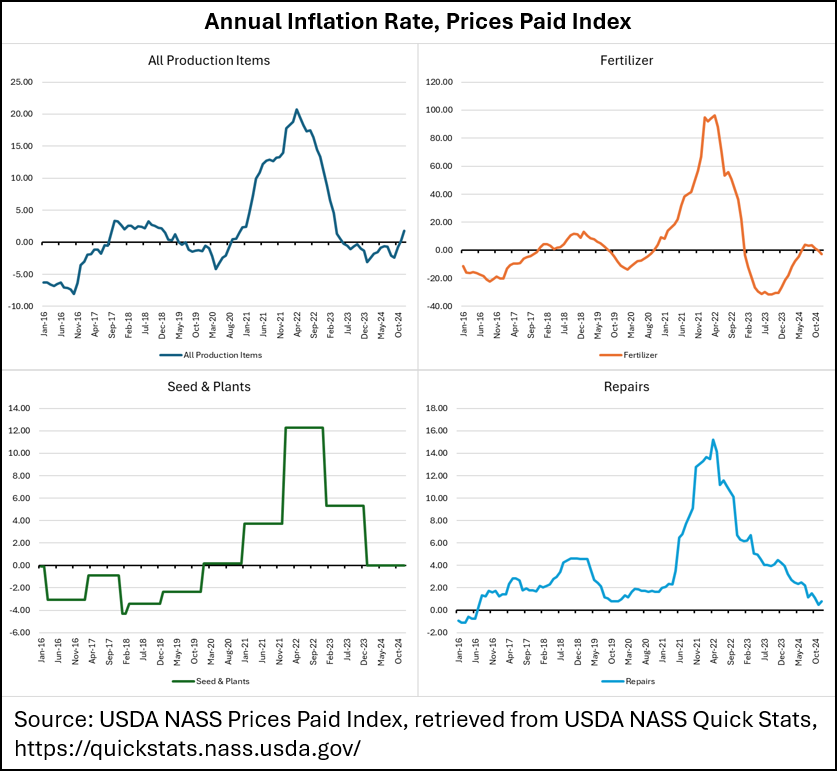
Figure 2. Annual Inflation Rate, Prices Paid Index, 2016-2024
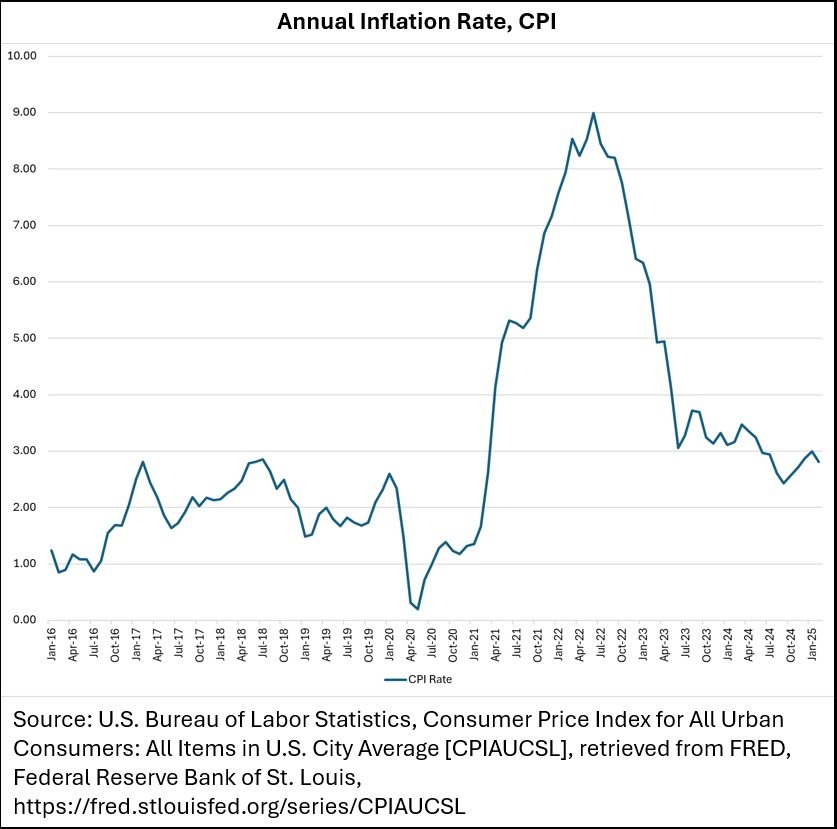
Figure 3. Annual Inflation Rate, CPI, 2016-2024