 As we enter a new year, producers are making plans for a new crop. Those plans will depend in part on their expectations regarding their costs of production. In this post, we’ll discuss our expectations for five important costs in 2025.
Production Costs in the Texas A&M AgriLife Budgets
The main contributors to production costs in the Texas A&M AgriLife Extension Economics budgets are seed, fertilizer, chemicals, and fuel/energy. We’ll focus on costs for those four inputs here.
Seed
Tables 1 and 2 report the average seed costs for corn, cotton, sorghum, and wheat as reported in the USDA ERS Commodity Costs and Returns surveys. Over the five years reported here, seed costs increased an average of 6.1% year-over-year for the United States. For the Prairie Gateway region, which contains the high plains and rolling plains, the average year-over-year increase is 6.8%. Depending on the crop, it seems reasonable to expect anywhere from a 5% to 7% increase in seed costs this year.
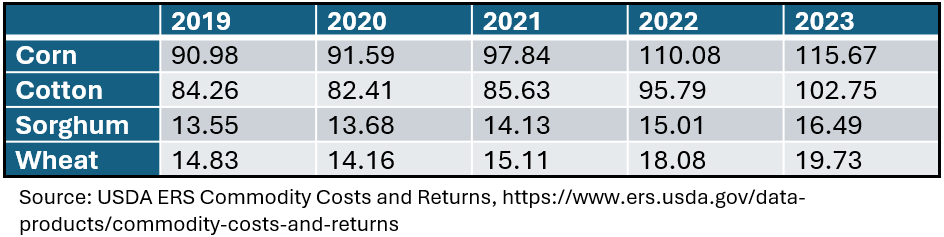
Table 1. Estimated Seed Costs for Selected Crops in the United States
Table 2. Estimated Seed Costs for Selected Crops in the Prairie Gateway
Fertilizer
After reaching record-high prices in 2022, fertilizer prices fell throughout 2023 and 2024, as shown in Figure 1. Whether this trend continues depends on three things. First, the balance of global supply and demand. For now, these forces appear to be in balance; there is neither an indication of major shortages nor surpluses of fertilizer. However, Russia, China, and the Middle East are all major producers of fertilizer. An escalation of the Russia-Ukraine war, the Israel-Iran conflict, or the China-Taiwan conflict would likely push prices up. A second related factor to watch is the state of trade relationships between the United States and its global suppliers, including Russia and China. Should the United States increase its trade restrictions (tariffs and sanctions) on these nations, fertilizer prices in the U.S. will likely face upward pressure. Finally, we must keep the local supply and demand situation in mind. Labor disputes and shortages in the transportation sector of the U.S. economy increase the cost of moving fertilizer from ports to local suppliers and put upward pressure on local prices. Then, these suppliers may over- or understock their fertilizer supplies based on what they expect local demand to be. A local shortage situation would put upward pressure on prices, while a local surplus would have the opposite effect.
This is all to say that there is a lot of uncertainty around fertilizer prices right now, both globally and locally. Unless any of the major changes I’ve mentioned here occur, it’s reasonable to expect fertilizer prices to remain steady this year. However, there seems to be more upward price pressure in the unknowns than there is downward pressure.
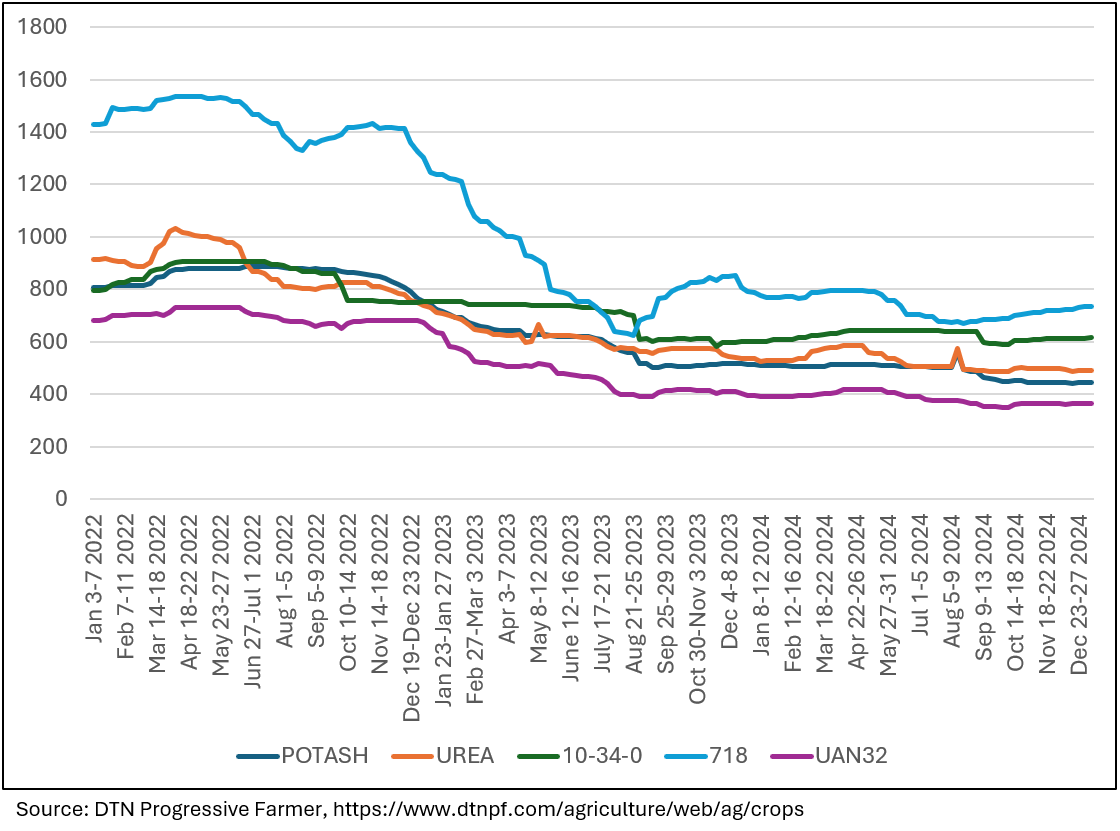
Figure 1. Retail Fertilizer Prices, 2022-2024
Chemicals
The chemicals story is like the one for fertilizer. After reaching record-high prices in 2022, chemical prices fell throughout 2023. Changes in prices as measured by the Producer Price Index (PPI) leveled off in September 2023 and have remained essentially unchanged since (Figure 2). Based on this trend, it seems likely that chemical costs will remain stable this year unless a major shock occurs in the market.
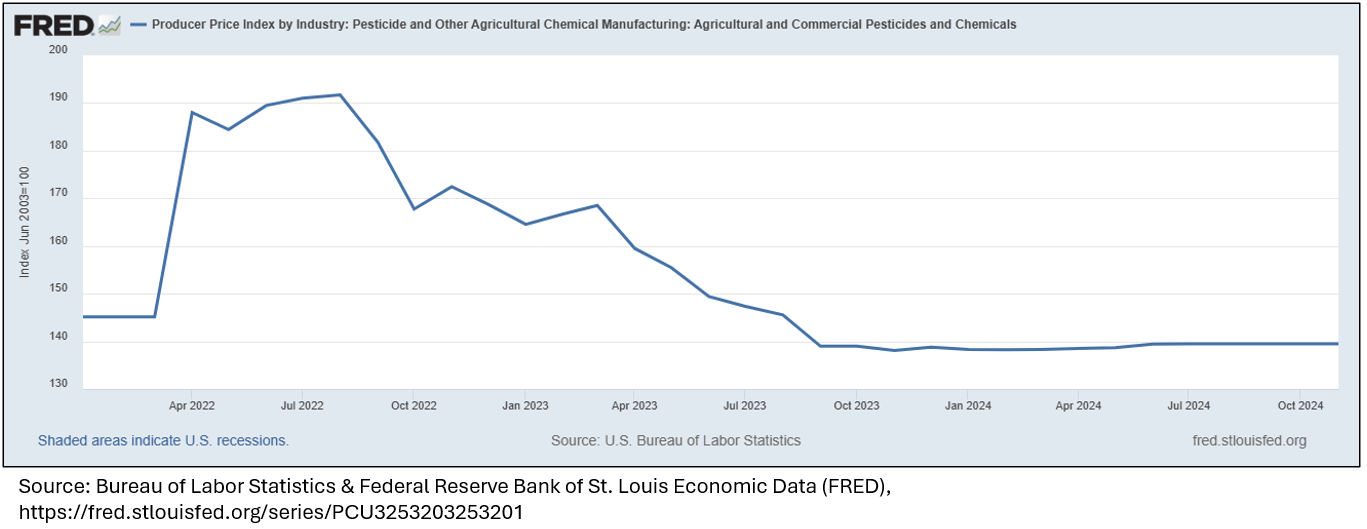
Figure 2. Producer Price Index: Agricultural and Commercial Pesticides and Chemicals, 2022-2024
Fuel/Energy
On-farm energy expenditures come primarily from three sources: energy used to pump water for irrigation, gasoline, and diesel fuel. The current short-term energy outlook from the U.S. Energy Information Administration indicates that gasoline and diesel costs in 2025 will remain at or near their 2024 levels. However, natural gas prices are expected to increase. EIA predicts an average Henry Hub spot price of $3.10/MMBtu for natural gas in 2025, which is a $0.90 increase over the average 2024 price. For gasoline and diesel fuel, EIA predicts average retail prices of $3.20/gal and $3.70/gal respectively. Both these predictions reflect an expectation that fuel prices will decrease in 2025 compared to 204.
What About Interest Rates?
The Federal Reserve began to decrease interest rates in September of last year and has indicated it will continue to decrease rates in 2025. The immediate impact of the Fed’s rate decrease on agricultural loan rates is illustrated in Figure 3. Agricultural loan rates decreased by about 6% in the fourth quarter of 2024 compared to the third quarter. Depending on how fast the Fed brings rates down this year, ag loan rates may end up somewhere in the low 8% or high 7% range this year.
Tips for Managing Costs
It looks like 2025 will be another year of high costs, low commodity prices, and tight margins. For this reason, we encourage producers to make every effort to manage their input use to keep costs as low as possible. I offer these suggestions for the year:
- Communicate your needs with your suppliers. Make sure your suppliers know your needs so that they manage their inventory well and so you avoid the local supply shortages that I mentioned earlier.
- Research the quality of any input you plan to use before you purchase it. One of the most important decisions you will make is the seed variety you plant. Make sure you choose a variety that is right for your soil and production system. For cotton producers in District 2, you can see the results of Ken Lege’s RACE trials on the Lubbock Research and Extension Center website.
- Consider the impact of your decisions on profitability, not yield. If boosting yield costs more than the market value of the extra production, you lose money. If reducing costs means you lose more in revenue than you save, you lose money. Make sure cost increases create larger revenue increases. Make sure cost savings don’t result in larger revenue losses.