Over the past couple of months, wheat prices have experienced a decline, reaching close to breakeven prices for many of us across the plains.
Board Update 8/28/2023

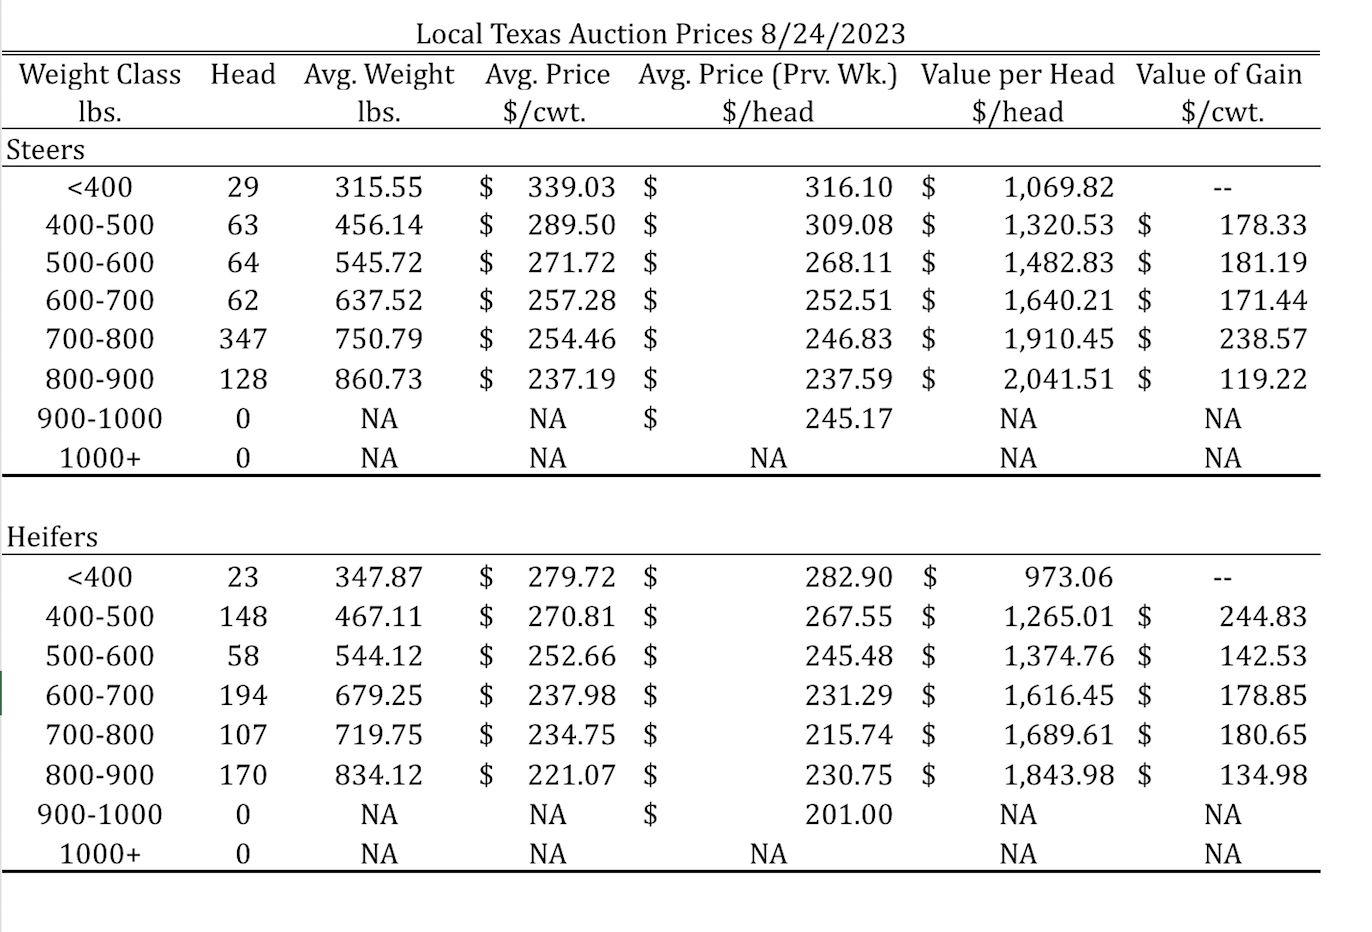
Tulia, Amarillo, Dalhart Average – Cattle Prices by Category 8/24/2023

Dates & Deadlines
9/7/2023 – Online – Return of the Natives Webinar
10/5/2023 – Online – White Tail Deer Management
10/23-27/2023 – College Station – Ranch Management University
11/2/2023 – Online – Wildfire and Prescribed Fire on Your Property
Market Trends and Insights
Wheat prices have shown a consistent weakening trend compared to the robust years we’ve had, marked by the influence of La Niña for three consecutive years. Despite low US stocks and lower global reserves, prices have been downward. This new level of prices might be lower than the economic breakeven prices calculated for many regions in our districts.
The 2024 KC HRW contract prices follow the seasonal pattern, usually showing the best marketing opportunities a year ahead. The market showed some volatility in the last couple of months due to the uncertainty surrounding the future of Black Sea exports. However, prices are declining compared to what we saw last year.
Graph 1. KC HRW 2024 July Contract. Source: Mark Welch
U.S. Supply and Demand – Low-Ending Stocks
U.S. wheat production and acreage have finally increased in the US due to last season’s high prices compared to the previous two. The latest WASDE report projected 37.9 million acres of harvested wheat, with an average yield of 45.8 bushels per acre. As a result, the US anticipates a 5.1% increase in total wheat production (Tabe 1).
Table 1. Projected 2022/23 Ending Stocks.
On the demand side, US consumption remained steady for the past decade. Total consumption in the US was 1,039 million bushels. The export outlook projects a 7.7% decrease due to the comparatively higher US prices against global competitors (Graph 2 These competitors’ FOB wheat market prices have been consistently lower since June 2021.
Graph 2: International Daily FOB Export Bids. Source: USDA- Grain: World Markets and Trade
Ending stocks are expected to remain lower, hovering around 615 million bushels. This amount significantly differs from the 1,000 million bushels threshold observed in previous seasons. In those times, prices had hovered around $5 per bushel. Based on these stocks, the USDA projects an average farm price of $7.5 for the 2023/24 season.
Worldwide Market Drivers.
The worldwide demand for wheat has outpaced production over the last five seasons. With global production reaching a peak of 796.37 million metric tons, domestic use has followed suit with steady growth. As per the WASDE projection, the total domestic use of wheat worldwide is set to reach 796.07 million metric tons.
On the contrary, the ending stocks on a global scale have experienced a decline during this period. For the 2023/24 season, the WASDE forecast ending stocks at 265.61 million metric tons, reflecting a carryover of 33.37%.
Table 2. World Wheat Demand and Supply. Source: USDA-WASDE Aug. 2023
What can we expect for next season?
Higher world wheat consumption levels and commodity prices will support higher wheat prices. Further, geopolitical turbulences, as we have seen with Russia and Ukraine, might add more volatility to the market, potentially affecting US exports. On the other hand, higher worldwide production and lower wheat prices from our competitors might decrease US exports and put a ceiling on wheat prices, as we have seen lately.
Future prices and higher costs have tightened the expected margins, increased breakeven prices, and increased our risk. Stay ready for changing market dynamics. A solid marketing plan and smart production practices are crucial.