 The USDA National Agricultural Statistics Service (NASS) released its latest crop production report and World Agriculture Supply and Demand (WASDE) report today. In this post, we’ll look at what these reports have to say about 2023/2024 cotton production, supply, and demand.
Board Update 8/14/2023

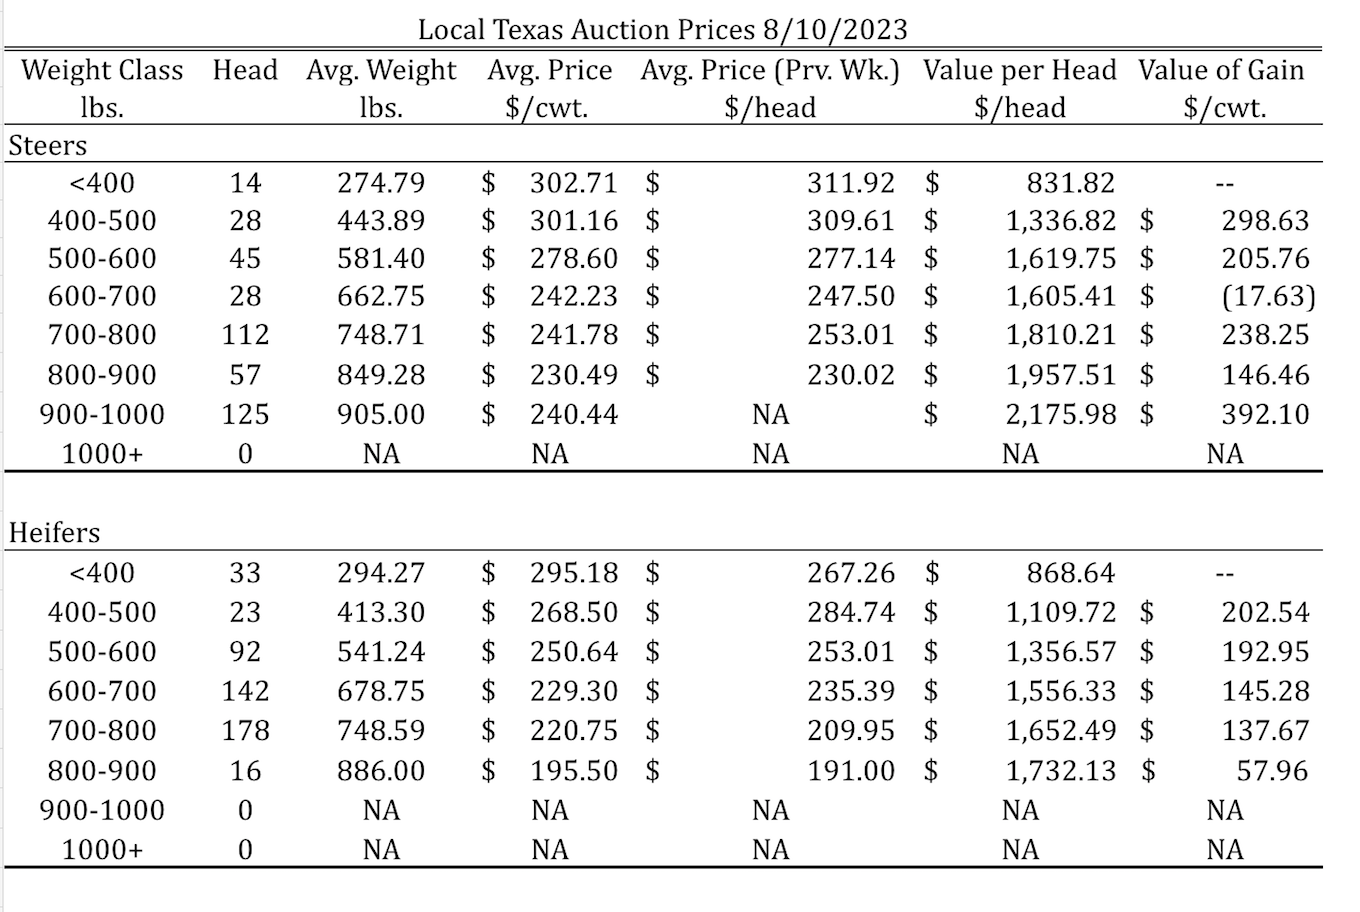
Tulia, Amarillo, Dalhart Average – Cattle Prices by Category 8/10/2023

Dates & Deadlines
8/18-8/19/2023 – San Angelo, Texas – Texas Sheep and Goat Expo
9/7/2023 – Online – Return of the Natives Webinar
10/5/2023 – Online – White Tail Deer Management
Crop Production
Table 1 compares the numbers for area planted and harvested, yield, and production in 2022 and 2023 as they are reported by NASS. Note that the numbers for 2023 area planted is based on surveys taken on growers while the numbers for 2023 harvested acres, yield, and production are projections based on historical trends in production and abandonment.
Table 1.U.S. Cotton Area Planted & Harvested, Yield, and Production (2022 and 2023)

There are a few things to note in these numbers. First, NASS revised their initial estimate for acres planted this year down by about 169,000 acres. Second, even though planted acres in 2023 are about 19% less than in 2022, the NASS expectation for acres harvested in 2023 is significantly higher than in 2022. That said, the expected yield from this year’s crop is much lower than normal, so total production is expected to decrease by almost 500,000 bales relative to 2022 production.
WASDE Report
Table 2 shows how expected U.S. cotton production affects cotton supply and use in the WASDE report. As shown in the table, total U.S. cotton supply is expected to be about 500,000 bales less this year compared to last year, while use is only expected to decrease by about 200,000 bales. As a result, ending stocks in 2023/24 are expected to decrease by about 16%.
Table 2. U.S. Cotton Supply and Use (1,000,000 bales)

Table 3 illustrates how the WASDE projections for the 2023/24 crop changed from July to August. In total, the changes made in the August WASDE projections for U.S. cotton supply and demand are mostly bullish. Although beginning stocks increased and use estimates decreased relative to the July projections, ending stocks were revised downward by about 700,000 bales from July to August.
Table 3. WASDE Projections for Cotton Supply and Use, July and August 2023

Initial Market Response
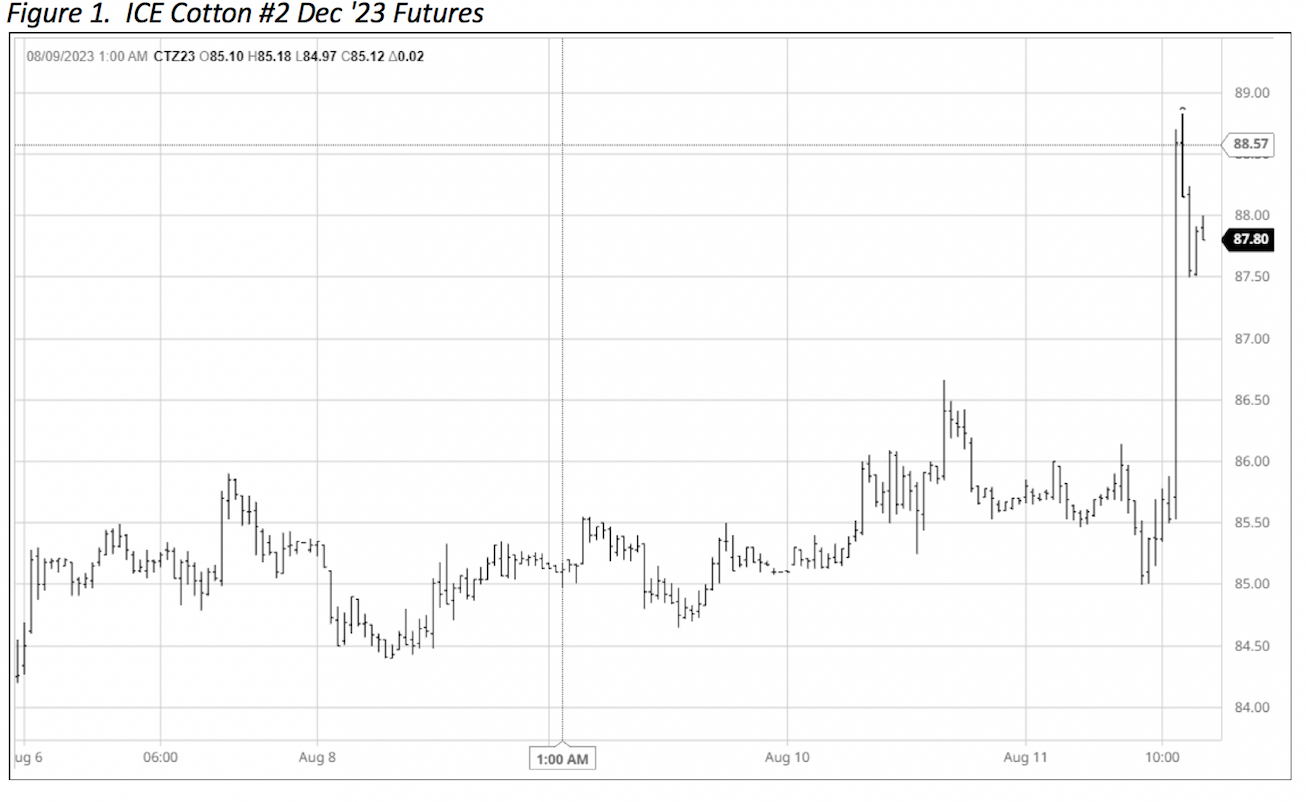
Although it is still early to know how the markets will ultimately respond to the news coming out of the USDA today, the initial response has been a sharp increase in ICE cotton futures. As shown in the figure below (source: barchart.com), the December ’23 contract traded consistently between 84.50 and 86.00 cents per pound this week before jumping today to a high near 89.00 cents per pound. At today’s closing, the December contract had settled at 87.8 cents per pound.
