 Inputs costs are expected to stay high in 2023, and the Federal Reserve has indicated that it intends to continue raising interest rates as it attempts to bring inflation under control. So how can you maintain the financial health of your operation in the current economic climate? One tool to consider is financial ratio analysis.
Board Update 3/6/2023

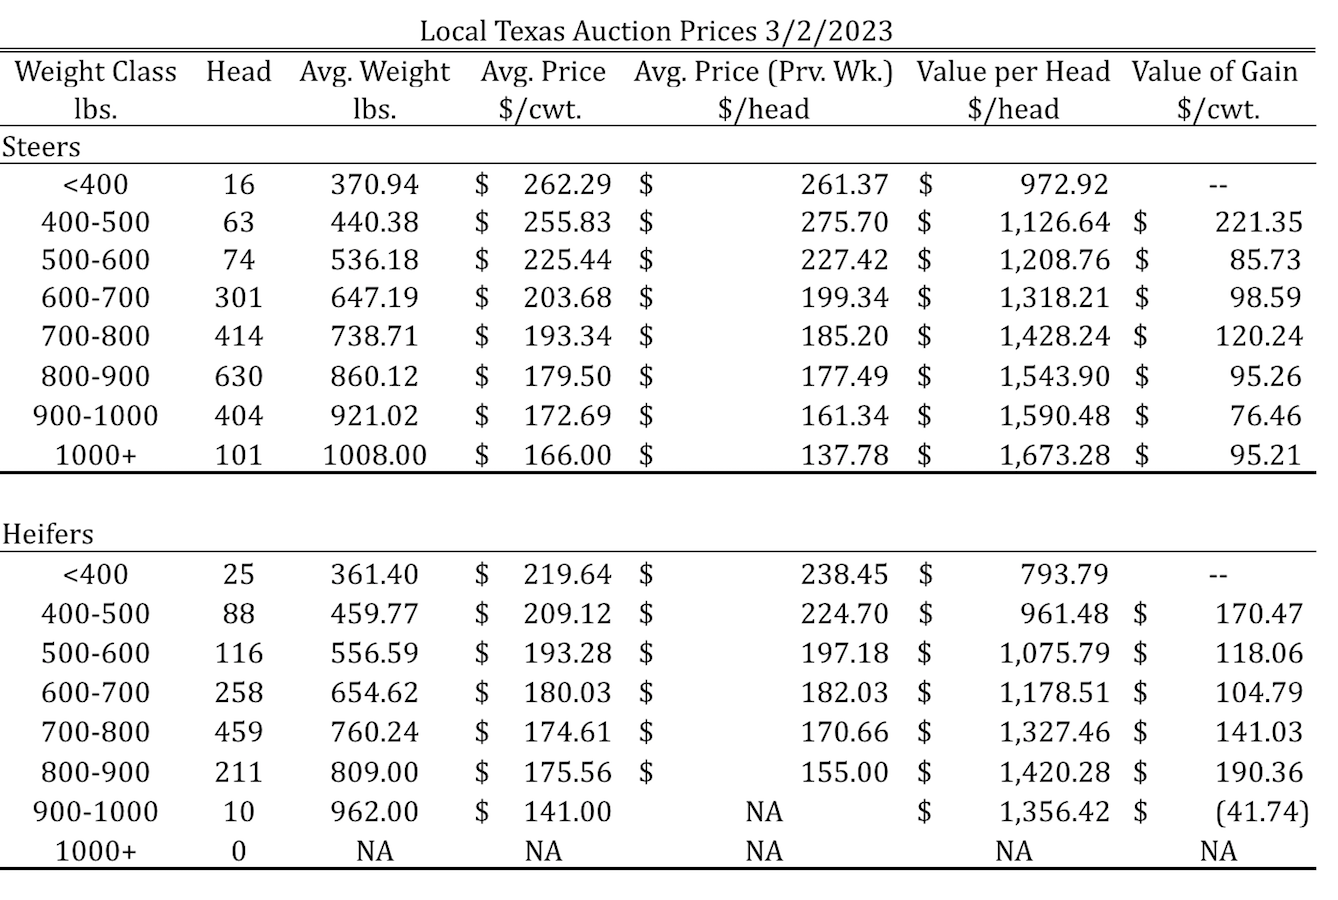
Tulia, Amarillo, Dalhart Average – Cattle Prices by Category 3/2/2023

Dates & Deadlines
3/27-31/2023 – Ranch Management University
4/6/2023 – RWFM Stewardship Webinar Series: Water Law Overview & Update
4/14/2023 – Owning Your Piece of Texas
4/19-21/2023 – Prescribed Burn School
4/25-26/2023 – Hemphill County Beef Conference, Canadian
What We’re Reading
Cattle inventory confirms large-scale contraction – Morning Ag Clips
The Cattle Price Discovery and Transparency Act – Morning Ag Clips
Hay supply near 50-year low, prices near record highs – AgriLife Today
Cotton harvest aid: A bit of science, a bit of art – Southwest Farm Press
Key Financial Ratios to Watch in 2023
Financial ratios provide business owners with important information about the financial health of their business. Most financial ratios can be calculated from information found in the balance sheet, income statement, and statement of cash flows and measure one of five areas of financial health:
- Liquidity – the business’s ability to pay its financial obligations that are due within one year.
- Solvency – the business’s ability to pay all its financial obligations, regardless of when they are due.
- Profitability – the size of a business’s profit relative to the size of the business.
- Financial efficiency – how well a business controls its costs and uses its assets to generate revenue.
- Repayment capacity – the business’s ability to generate funds to make payments on intermediate and long-term debt.
In this post we will look at three key ratios to monitor in your business in 2023.
The Current Ratio
The current ratio compares the size of a business’s current assets (cash, inventories, and other items that are easily converted to cash) to the size of its current liabilities (financial obligations that must be paid within one year). If current assets equal current liabilities, the current ratio equals 1.00, if current assets are greater than current liabilities the current ratio will be greater than 1.00, and if current assets are less than current liabilities the current ratio will be less than 1.00.
As a rule, you should aim to maintain a current ratio greater than or equal to 2.00. That is, the value of your current assets should be at least twice that of your current liabilities. If this is the case, you should have the ability to generate all the cash you need to finance your planned operating costs along with additional cash to meet any unforeseen expenses.
The Debt-to-Asset Ratio
A second financial ratio to watch this year is the debt-to-asset ratio, which measures the value of your business’s liabilities relative to the value of its assets. A debt-to-asset ratio of 1.00 indicates that a business is financed entirely using borrowed funds. In other words, if you ended your business today, sold off all its assets, and paid your creditors what you owed them, then there would be nothing left over for you.
You should aim to keep your debt-to-asset ratio below 0.50, which means that you own more than half of your business outright. That said, keep in mind that the definition of a “good” debt-to-asset ratio can change with the way you choose to operate your business and with the age of your business. A farm that leases or rents most of the land and capital equipment that it operates with will not own as many assets and for this reason may have a different debt-to-asset ratio when compared to a similar farm that has chosen to purchase and own its assets. An older farm will have had more time to make payments on debt used to purchase assets and so will likely have a lower debt-to-asset ratio than a newer farm that owns a similar set of assets.
Term Debt and Capital Lease Coverage Ratio
A third ratio to watch on your operation is the term debt and capital lease coverage ratio (which I’ll abbreviate as TDCL for the rest of this post). This ratio measures your business’s repayment capacity and compares the amount of cash you should have on hand to make payments on debt to the size of any scheduled payments you must make on leases, term debt principal, or interest on term debt. A TDCL value of 1.00 indicates that your business will generate exactly the amount of cash you need to service any scheduled lease and debt payments.
A good benchmark TDCL value is 1.50, which means you should generate 1.5 times the cash needed to make payments on existing leases and term debt principal and interest. At this level of repayment capacity, you should be able to comfortably meet your existing lease and debt commitments and take on additional term debt or lease commitments should the need arise.
Using Financial Ratios to Assess Financial Health
So how can you use these and other financial ratios to assess and maintain the financial health of your operation? The simplest way is to keep track of these ratios for your operation and to monitor how they change over time. As you make decisions, consider how those decisions will impact each financial ratio, and make improving these ratios an explicit part of your planning and goal setting. You should also take the time to speak with your lenders and learn how they use financial ratios when they evaluate loan requests. Most lenders have financial ratios that they prioritize in their analysis, along with benchmarks for those ratios. If you know what your lenders are looking for, you can more easily monitor your operation to make sure you meet their requirements. The benefits of doing this include easier access to credit when you need it and potentially lower interest rates on loans.