 Choosing which crop will be most profitable to produce each year can be difficult. For this reason, economists with Texas A&M AgriLife Extension have developed a spreadsheet tool to help producers with this decision. In this post, we will look at how this tool can help producers analyze and compare the profitability of a set of crop enterprises.
What We’re Reading
Recognize mental health challenges and symptoms after the wildfires – AgriLife Today
Texas wildfires impacting Panhandle ranchers but not overall cattle and beef prices – AgriLife Today
Feeding cattle after the fire – AgriLife Today
Disaster relief fund applications open to cattle raisers – Southwest Farm Press
Are you still storing corn? – Farm Futures
Sorghum’s market demand going strong – Kansas Farmer
2022 Census of Agriculture: Review of Southern Hay Prices – Southern Ag Today
U.S. Cotton Export and Global Market Share Declined in 2023 – Southern Ag Today
USDA Outlook Forum and Planted Acres – Southern Ag Today
Where to Find the Spreadsheet
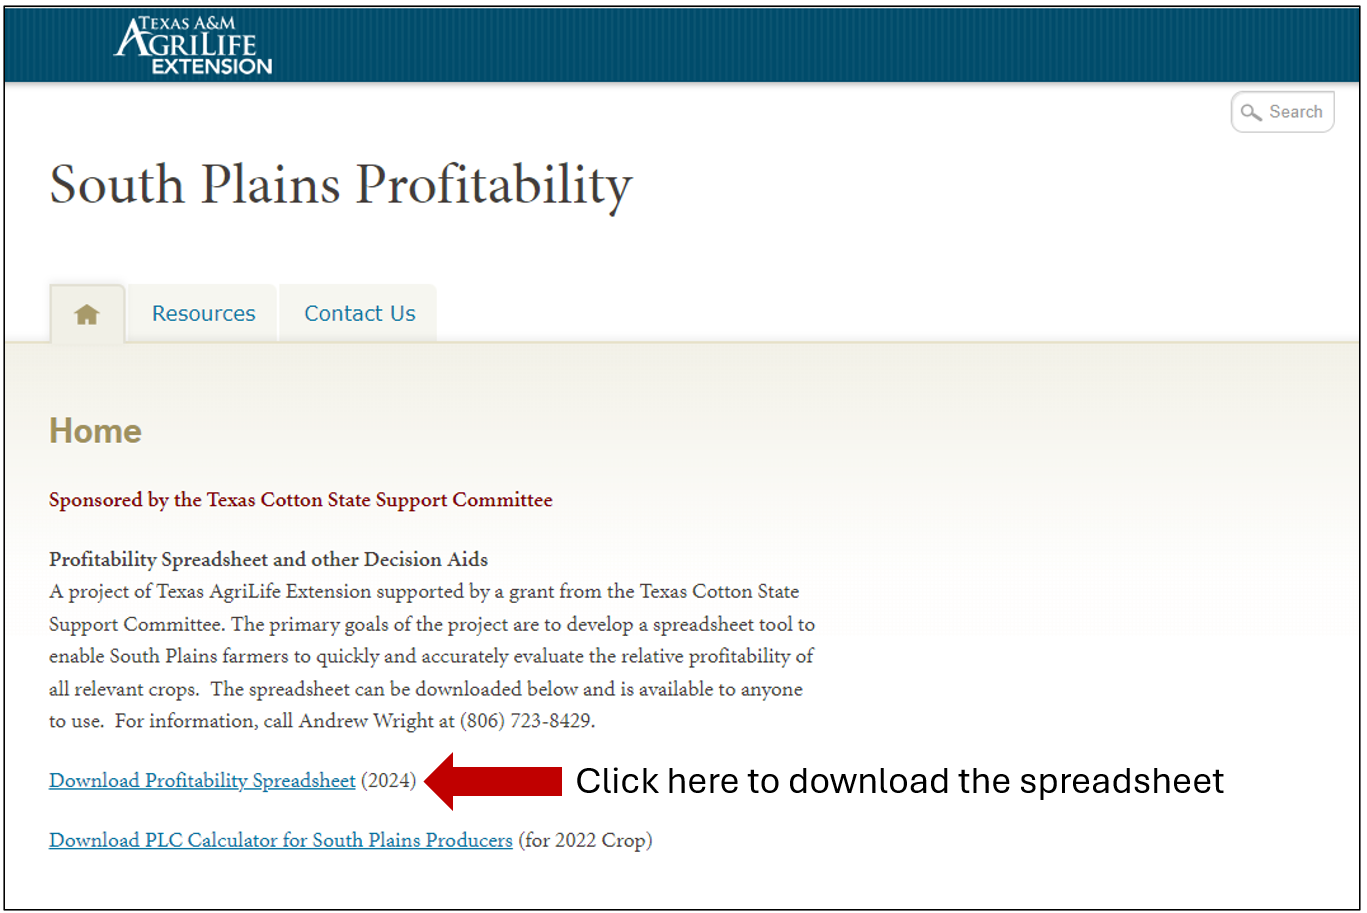
The South Plains Profitability Spreadsheet is a decision tool provided by Texas A&M AgriLife Extension Agricultural Economics with support from Cotton Incorporated State Support Program. To download the tool, go to the South Plains Profitability website and click on the link titled Download the Profitability Spreadsheet.
How the Spreadsheet Tool is Structured
The South Plains Profitability Spreadsheet is a decision tool made up of a set of spreadsheets in a single Microsoft Excel file that are designed to work together. The spreadsheets communicate with each other so that information input into one sheet is reflected in the others.
The spreadsheets in the tool are structured into three sections:
- Set up: the Instructions, Menu, and Prices sheets allow users to select the crops they want to focus on, enter their expectations for commodity prices and enter their price expectations for certain inputs that are common across all crops (e.g., labor, fuel, etc.).
- Crop Budgets: Each crop in the tool has a sheet dedicated to it. This sheet lists out a full enterprise budget for the crop that is based on the Texas A&M AgriLife Extension budgets for District 2. Users can adjust the input amounts and input prices in these budgets to reflect how they manage their operation.
- Analysis: the Break-Even and Comparative sheets use the information from all the other sheets to report break-even prices for each crop a user selects and to compare the revenues, costs, and returns above costs for those enterprises.
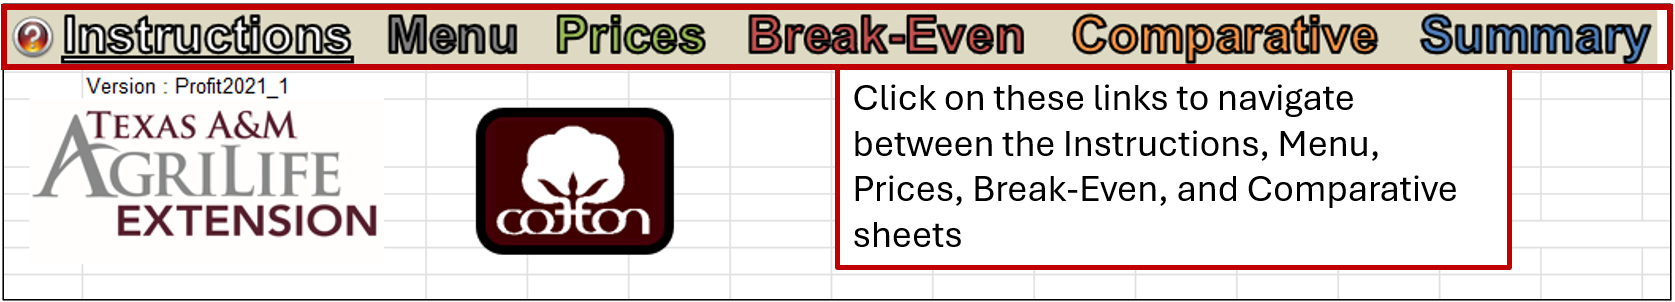
Access the Menu, Prices, Break-Even, and Comparative sheets using the links at the top of the spreadsheet, as shown here:
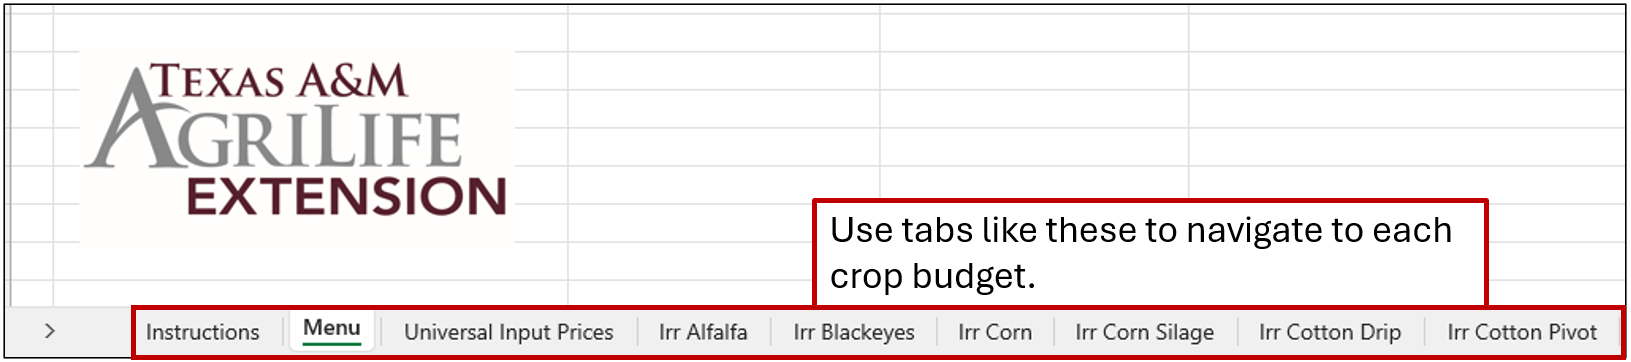
Access the crop budgets using the tabs and the bottom of the spreadsheet:
Setting Up the Tool
To use the tool, a user selects the crop(s) they want to focus on using the Menu sheet. Set the crops to focus on to “Yes” and the crops to ignore to “No”. This will hide the sheets and information related to the crops set to “No” in other parts of the tool.
To use the menu page users must access the spreadsheet in Excel with macros enabled. To enable macros in the spreadsheet, follow the instructions on the Menu sheet:

Users who access the tool in a different program or don’t enable macros won’t be able to use the Menu sheet but will still be able to use the other spreadsheets in the tool.
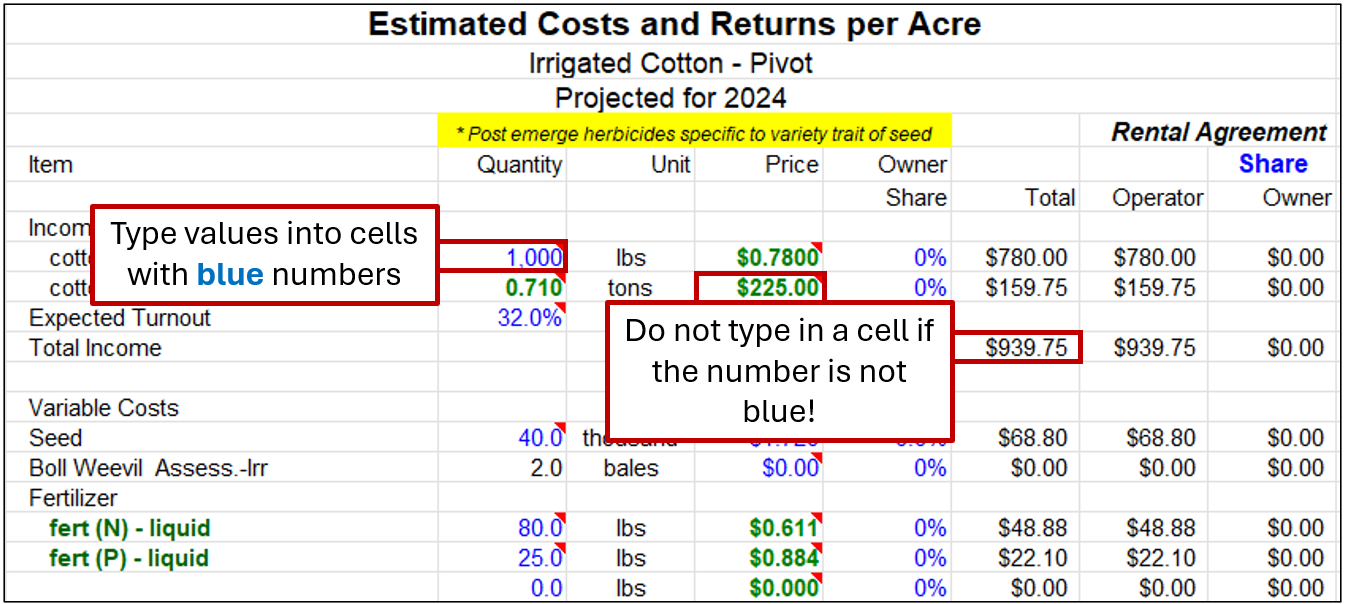
Next, users enter their expectations for commodity prices, yields, input amounts, and input prices in the Prices page and in each individual budget. Only make changes to numbers that are colored blue in these sheets. Any other values are calculated based on the information you input into the tool. For the most part, cells with numbers that a user should not change are locked so that you can’t accidentally erase a formula in the spreadsheet.
Example Scenario
To illustrate how the tool works, I’ve set up the following example: comparing the profitability of pivot-irrigated cotton to the profitability of irrigated sorghum silage. Here is how I set this up on the menu page.
On the prices page, I input a cotton lint price of $0.78/lb. and a cottonseed price of $225/ton. For sorghum silage, I input a price of $48/ton. In the pivot-irrigated cotton budget, I use a yield of 1,000 lbs./acre and make no other changes to budget. In the sorghum silage budget, I use a yield of 18 tons/acre and make no other changes. Once I enter this information into the tool, I can use the Break-Even and Comparison sheets to analyze the relative profitability of these two crops.
Using the Tool for Break-Even Analysis
On the Break-Even Comparison sheet, you will see a set of possible break-even prices for each crop you selected on the menu page. If you didn’t use the menu page, you will need to scroll through the entire list of crops included in the tool to find the ones that you want to focus on.
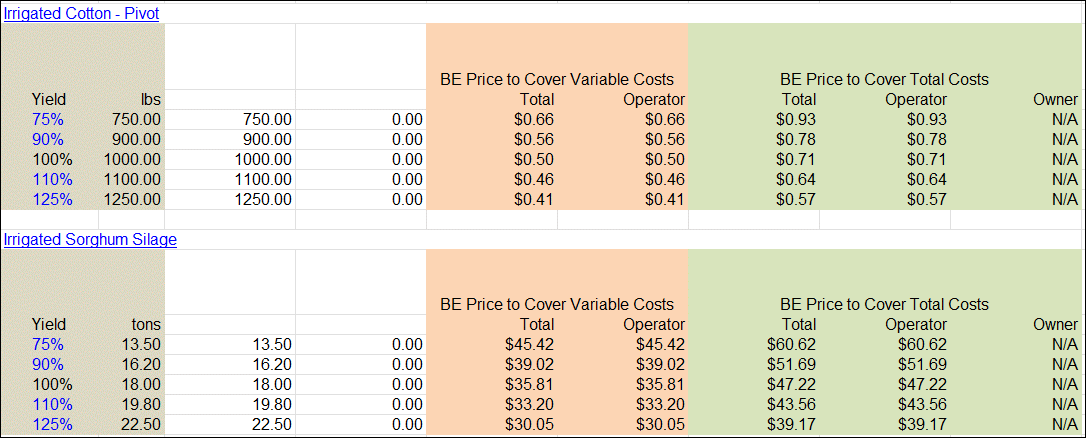
The tables on this sheet tell users the selling price they will need to receive to exactly cover their variable and total costs in different production scenarios. Using cotton as an example, If I produce 1,000 lbs./acre, I need to receive a lint price of $0.41/lb. to cover my variable costs per acre. I need to receive $0.57/lb. to cover my total costs per acre. Moving away from the row of the table tells me how the break-even prices change if I produce more or less than expected.
Using the Tool to Compare Returns from Different Enterprises
The Comparative Returns sheet summarizes information about total revenue, variable and total costs, and returns above both variable and total costs for each crop enterprise that you selected on the menu page (or for all possible crops if you did not turn any budgets off). This page simply allows you to easily compare the net returns (returns of variable and/or total costs).
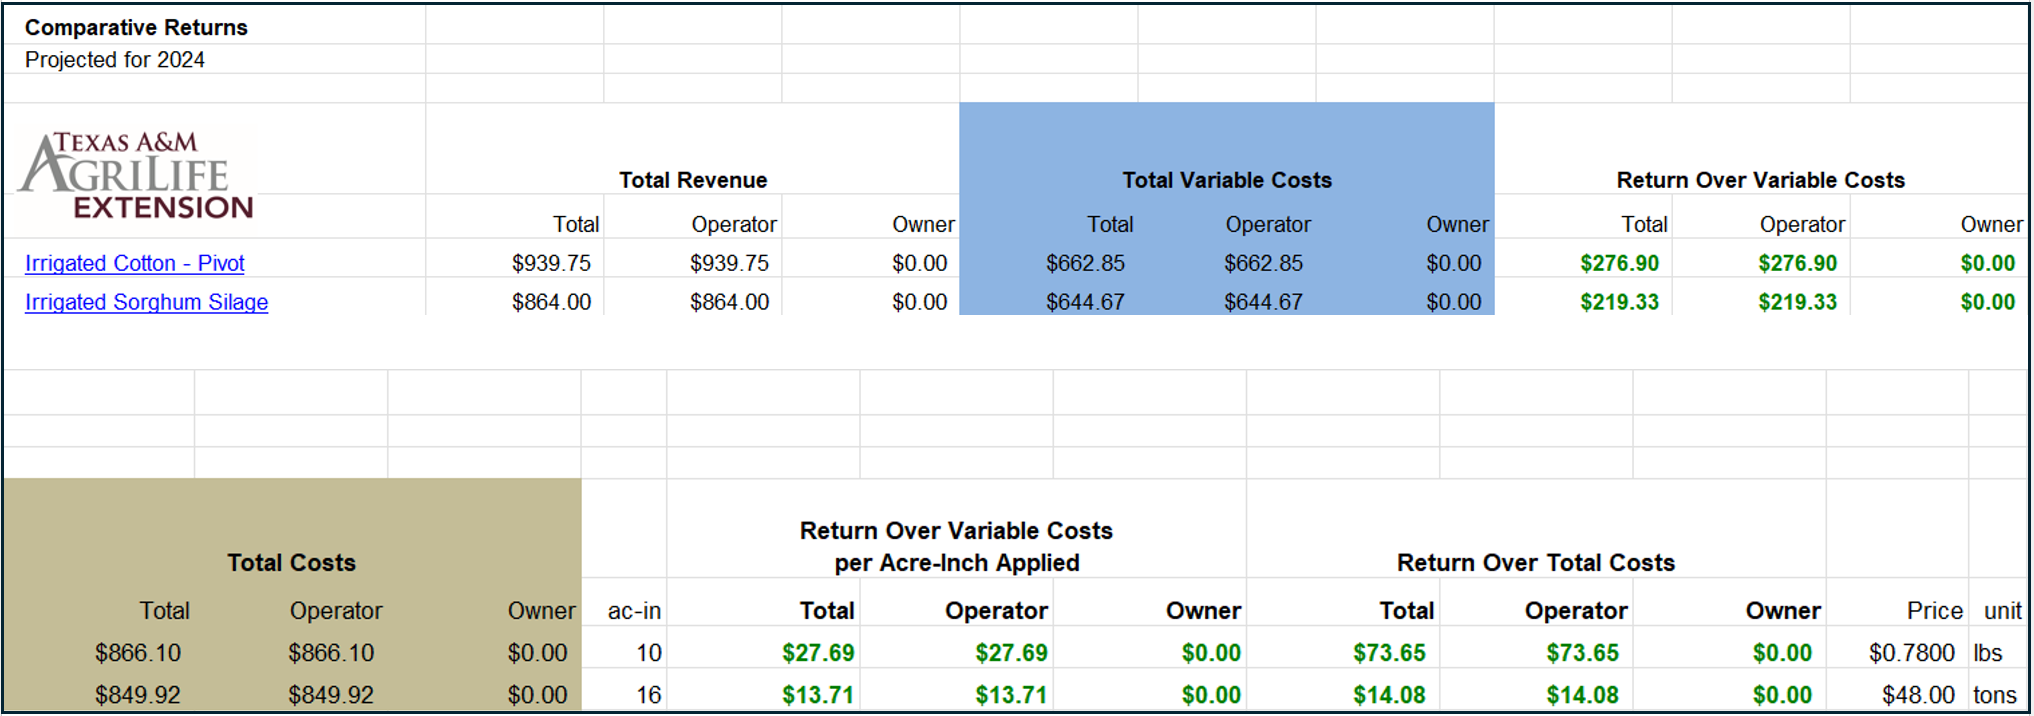
In this illustration, both pivot-irrigated cotton and irrigated sorghum silage show positive returns over variable costs and returns over total costs. Either enterprise will return a profit this year, if my assumptions about prices and inputs are correct. Cotton’s returns over variable and total costs are higher; therefore, cotton appears to be the more profitable option.
South Plains Profitability Workshops
AgriLife Extension economists will offer two South Plains Profitability Workshops this spring. These workshops are free, feature cotton and grain market updates, and provide hands-on training for the South Plains Profitability Spreadsheet.
The workshops are scheduled for March 20 in Dimmit, TX and for April 11 in Plainview, TX. For more information check out these links:
- Workshop Announcement: https://agrilifetoday.tamu.edu/2024/02/19/profitability-spreadsheet-workshops-for-producers-set-in-south-plains/
- Calendar event for Dimmit: https://calendar.tamu.edu/agrilife/event/318023-crop-profitability-spreadsheet-workshop-dimmit
- Calendar event for Plainview: https://calendar.tamu.edu/agrilife/event/318024-crop-profitability-spreadsheet-workshop-plainview
You can also contact Andrew Wright at andrew.wright@ag.tamu.edu or by phone at 806-723-8429.