(Laura McKenzie/Texas A&M AgriLife Marketing and Communications)
The 2023 crop and livestock budgets for District 3 are posted, and the budgets are available for all districts on the AgriLife Extension Agricultural Economics website. Today, we look at the expected costs and returns from the Cow-Calf budgets in the Rolling Plains.
Board Update 3/27/2023

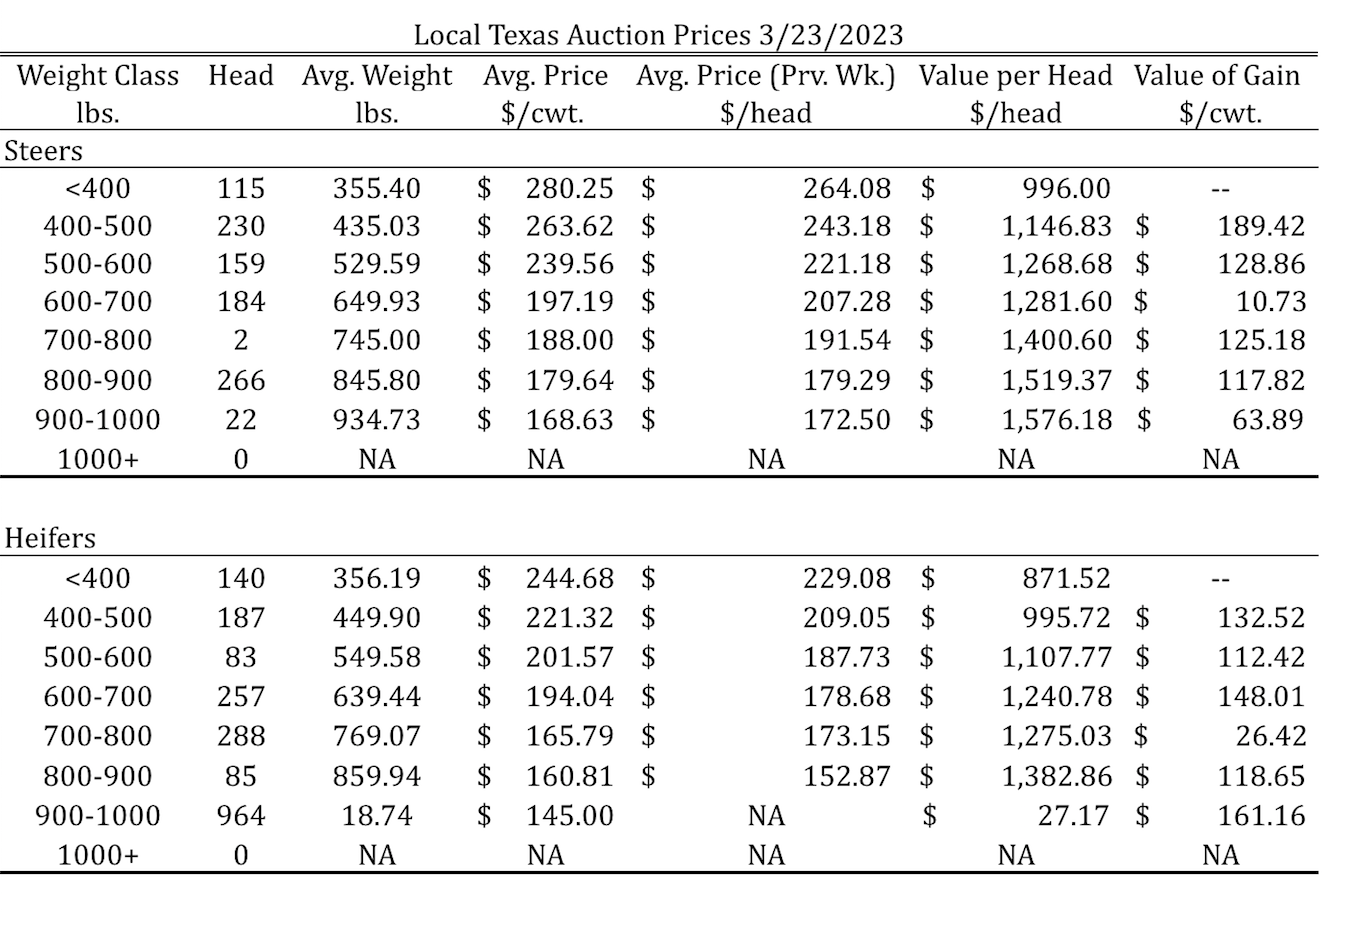
Tulia, Amarillo, Dalhart Average – Cattle Prices by Category 3/23/2023

Dates & Deadlines
3/27-31/2023 – Ranch Management University
4/6/2023 – RWFM Stewardship Webinar Series: Water Law Overview & Update
4/14/2023 – Owning Your Piece of Texas
4/19-21/2023 – Prescribed Burn School
4/25-26/2023 – Hemphill County Beef Conference, Canadian
5/4/ 2023 – RWFM Stewardship Webinar Series: Wild Pigs in Texas
A Look at the 2023 Cow-Calf Budgets
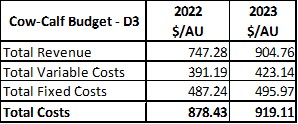
Texas A&M AgriLife Extension economists around the state are in the process of completing and posting annual budgets. These budgets provide an expectation of production expenses, revenues, and profits. Table 1 summarizes the revenue and costs numbers per animal unit basis in the 2022 and 2023 extension budgets for the Rolling Plains Cow-Calf production system in District 3 in 2023 (Table 1).
Table 1. Rolling Plains Cow-Calf budgets ($/AU)
In the budgets, the expected price of steer and heifers’ calves increased year to year from roughly $179/cwt and $170/cwt to $210/cwt and $200/cwt between 2022 and 2023. Opportunely, this price increase helps to offset the increment in the cost of production that we have seen these last years due to higher input prices and the effect of the drought (Graph 1).
Graph 1. Summary District 3 Cow-Calf Total Production Costs
During 2023 we are expecting an improvement in the returns over variable costs and total costs compared to 2022 and previous years (Table 2). Both variable and fixed costs were used to calculate the economic return. Variable costs include feed, hay, fuel, labor, credit line interest, utilities, etc. The budget accounts for increased feed and hay due to prices and higher quantities used to offset last year’s forage shortage. Fixed costs include depreciation of equipment and bulls, equipment opportunity costs or interest payment on the equipment, a management fee, salaried labor, and land lease costs.
Table 2. Expected Per-AU ROVC and ROTC
The economic analysis considered all expenses associated with cow-calf production. However, even if the return above total costs is negative, some ranches will still cash flow depending on the amount of non-cash expenses such as depreciation, management fee, and land and equipment opportunity costs.
Breakeven Prices for 2023
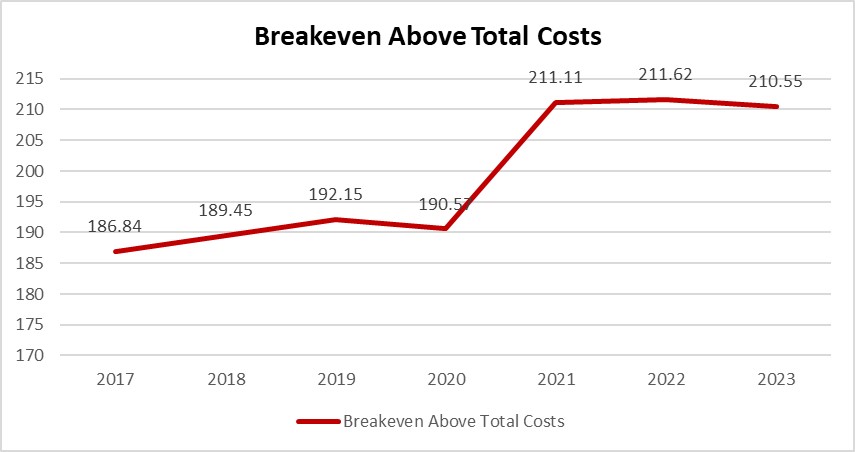
One significant value to be aware of in an enterprise budget is the commodity’s breakeven price. Graph 2 shows the breakeven prices to cover total costs reported in District 3 Cow-Calf budgets since 2017. We have seen an increase in breakeven prices, especially from 2021 to 2022. This increment in breakeven prices is mainly due to higher input costs and the effect of the drought on our production systems. For example, the breakeven price to cover total costs in 2023 resulted in $210.55/cwt for our budget, assuming a weaning rate of 85%.
Graph 2. Breakeven Prices to Cover Total Costs
Some Final Comments on the Budgets
There are a couple of things to remember as you use this information and the budgets for your district. First, the numbers in these budgets are general guidelines for wheat enterprises in their respective districts and will not represent every operation perfectly. To build a budget that better represents your operation, AgriLife offers tools to help you build your own budgets on our website. Another thing to remember is that the outlook for the 2023 cow-calf market is not yet fully formed.