Where are the fundamentals for the cotton market as we approach the end of the year? What does the global economic picture mean for the upcoming crop year?
Dates & Deadlines
12/19/2022 – Lamb County Ag Day, Littlefield
1/5/2023 – Southern Mesa Ag Conference, Lamesa
1/13/2023 – Pioneer Spring Crop Meeting, Panhandle
1/17/2023 – Pioneer Spring Crop Meeting, Hereford
1/18/2023 – Moore County Ag Meeting on Rebuilding the Herd, Dumas
1/18/2023 – Southeast Panhandle Ag Conference, Claude
1/19/2023 – Pioneer Spring Crop Meeting, Plainview
1/19/2023 – Texas Alliance for Water Conservation Annual Water College, Lubbock
01/24/2023 – 03/09/2023 – Master Marketer, Vernon.
1/24/2023 – Crop Profitability Conference, Perryton
1/25/2023 – Top of Texas Cotton Conference, Pampa
1/26/2023 – Northwest Panhandle Ag Conference, Dalhart
1/27/2023 – High Plains Cotton Conference, Spearman
What We’re Reading
Farmers will continue to face high input costs, tight crop margins in 2023 – AgriLife Today
2023 farm bill discussions relate to money – AgriLife Today
What Fed Interest-Rate Hikes Mean for Your Mortgage, Loans and Savings in 2023 – The Wall Street Journal
The Year Ahead: Forces That Will Shape the U.S. Rural Economy in 2023 – CoBank
The seasonality of calf prices and factors unique to 2022/2023 – Beef
Tips for reducing hay waste, feeding costs – Beef
Should I sell carbon credits? A decision guide for ranchers – King Ranch Institute
Cotton Market Update
Cotton Wrap for 2022
The 2022 year has been nothing if not dynamic for the cotton market. Cash cotton opened the year at roughly $1.12/lb. and rose to an in-year high of $1.53/lb. However, cash fell to an in-year low of $0.74/lb. on Halloween, and since December 1 has oscillated between $0.80/lb. and $0.86/lb. There are a variety of reasons for this volatility, and folks much more qualified than myself have dissected the reasons along the way. I’d encourage you to sign up for Dr. John Robinson’s weekly marketing news if you’re interested in keeping up with the day-to-day of the cotton market.
We can take a moment to review what this price volatility meant for profits across the board. The struggle for many, even those who marketed near peak values in May and June, was the loss of production due to a lack of moisture. USDA data shows roughly 38% failed acres across Texas, but as you approach Lubbock that share grows to more than 60%. Even where acres were not failed, there were certainly yield losses, lowering profits on a crop that was already battling unfavorable input prices. The dynamic prices and poor weather lead to a variety of outcomes depending on where you farm within the High Plains. The table below shows expected profit, net of an external payments, for a variety of yield and price combinations throughout the 2022 season.
Expected Profits for Combinations of Cotton Yield and Available Prices, 2022

Setting up 2023 Economic Conditions
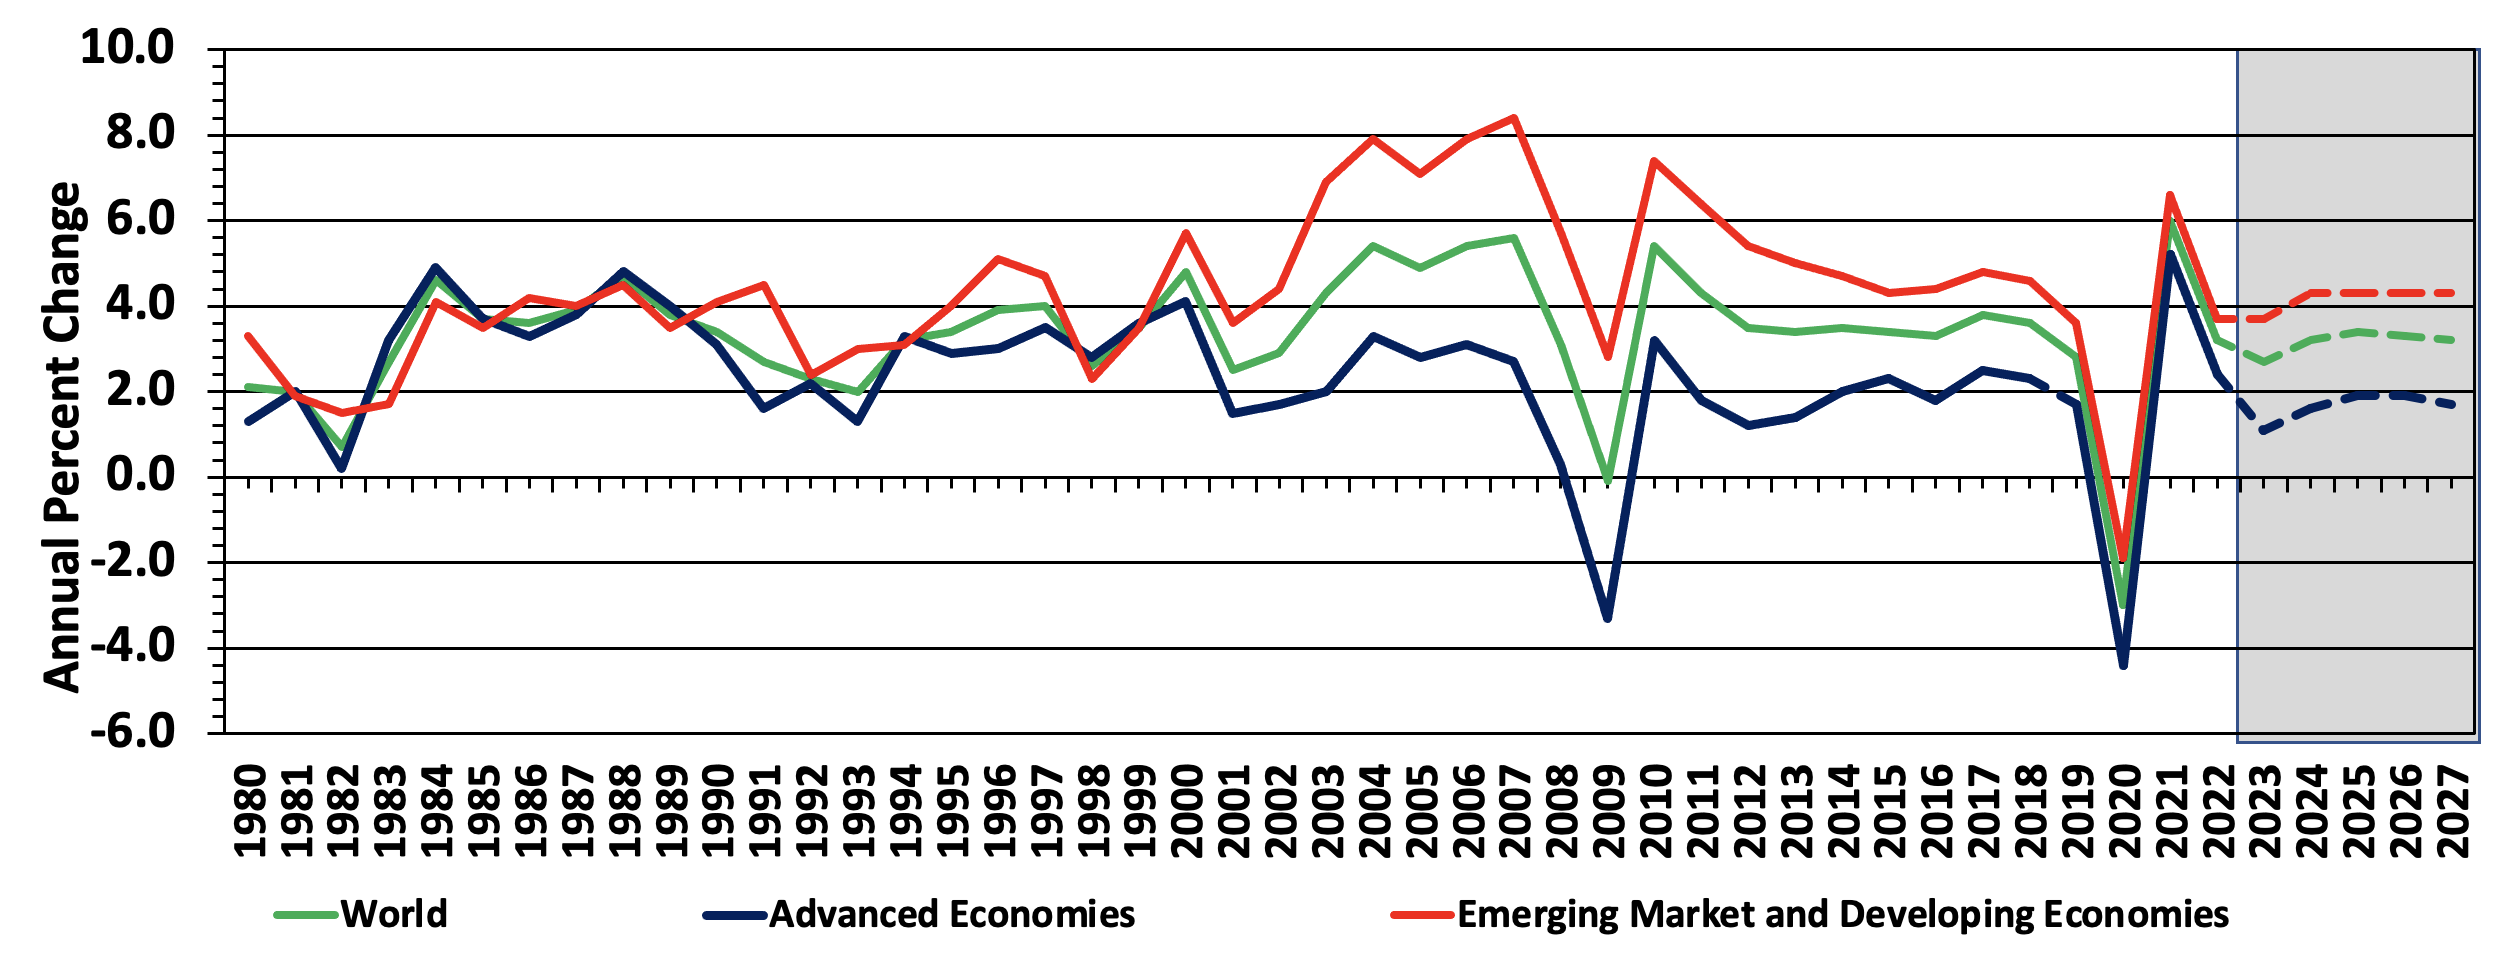
What do the experts tell us about prospects for the 2023 cotton crop? Any real movement will be tied to a very tight balance between supply and demand. The December 2022 WASDE estimates 14.24 million bales of production and 14.45 million bales of use in the 22/23 marketing year, representing a net gain in stocks of only 210 thousand bales (a rounding error on the balance sheets of some analysts). The rough balance of supply and demand also represents no gap in supply, pressuring prices downward for an expected SAFP is $0.85/lb.
Real GDP Growth, 1980 – 2027

World Economic Outlook, October 2022 http://www.imf.org
This roughly balanced market means that trade activity is likely to be driven in short bursts from small changes to the supply and/or demand side; weather market, consumption data, geopolitical whims. That brings us to the general health of the world’s economy. Indicators of economic health are mixed, if anything. Forecasts of 2023 Domestic GDP predict a sluggish 1% growth and a World Average GDP growth of roughly 3%. Cotton is generally the first crop to be hit by a bad economy as a major input into durable, nonessential goods. Even though inflation has kept the prices of many commodities high, in some cases the rising cost of finished goods may be a pressure on cotton. Even though finished goods cost more, they require the same amount of cotton per unit, and a loss of throughput volume (aka demand) would drive cotton lower if anything.
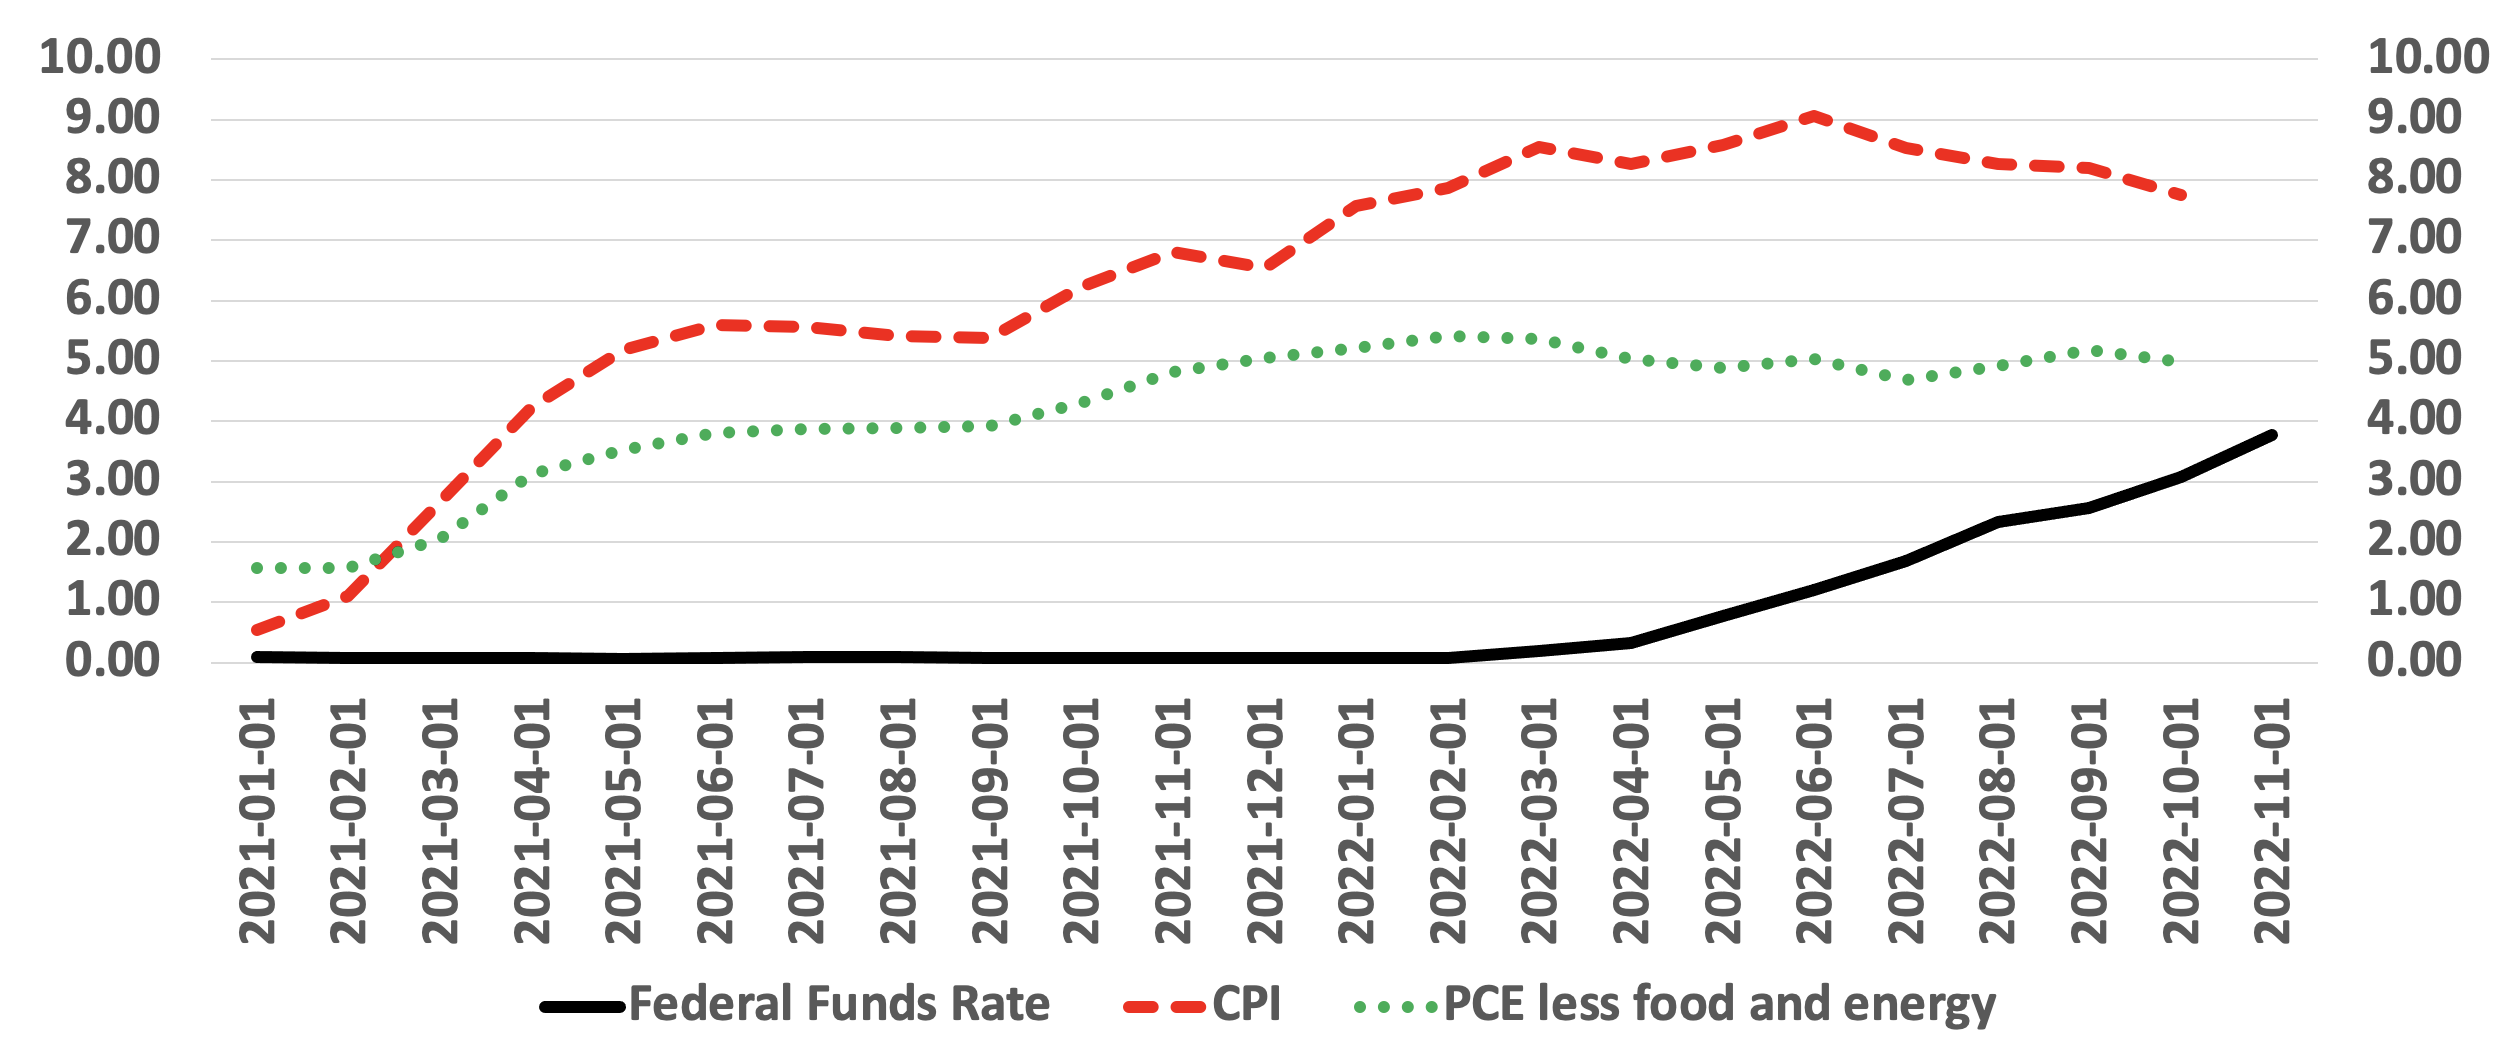
Interest Rates and Inflation

That being said, there does not appear to be overwhelming upward potential in cotton for the remainder of the marketing year, barring some massive change in the geopolitical spectrum. WASDE’s most recent data likely incorporates the majority of failed acres to be had, and even if you contest that data, the market probably already has your back. That means that any downward revisions are likely priced into expectations and if there is not a downward revision in the future, the market may take a tumble.

