 We continue with our fall market updates this week, spending some time with the corn and sorghum markets. With lower yields and higher prices, what are some early predictions for the marketing year and production year 23/24?

Dates & Deadlines
11/14/2022 – Kent and Stonewall Ag Support Program – Jayton
11/18/2022 – Cattle on Feed Report
11/29 /2022 – 12/1/2022 – Amarillo Farm & Ranch Show, Amarillo
12/13/2022 – Armstrong County Fall Producers Meeting, Claude
01/24/2023 – 03/09/2023 – Master Marketer, Vernon.
What We’re Reading
November WASDE: USDA raises corn, soybean yields – FarmFutures
Rise in partisanship complicates Farm Bill – Southwest Farm Press
USDA releases nationwide farmer, rancher and forest manager survey – Morning Ag Clips
Traditional holiday baking costs up – AgriLife Today
AgriLife Extension offers educational highlights at the Amarillo Farm and Ranch Show – Morning Ag Clips
Coarse Grain Market Update
We begin the marketing year with coarse grains strong, relative to a year ago, though down from summer highs. Cash corn rose 7.7% from November of last year, and cash sorghum rose 23.7% over the same period. This year’s market was a study in the influence of geopolitics on agriculture. Intermediate highs were largely driven by news from Ukraine. Spring and summer increases followed Russia’s invasion of Ukraine and resulting fears of a global food shortage. News of a safe-passage corridor for Ukrainian grain through the Bosphorus Strait and onto the global market cooled grain prices from summer highs through July and August, but Russia’s recent withdrawal from the agreement injected more uncertainty into the marketplace, supporting price increases.
Texas Cash Corn, Sorghum, Wheat, Weekly Price

Source: Dr. Mark Welch; Data from USDA, AMS, Market News: Tx cash = average (area North of the Canadian River, Triangle area from Plainview to Canyon to Farwell, area South of a line from Plainview to Muleshoe)
These geopolitical back-and-forths are adding uncertainty to an already tight global stock of grain. Both U.S. stocks and World stocks, net of China, are lower than 40 days of use; a level the economist Bob Wisner found to induce significant price spikes outside of the recent historic norms.
Corn Days of use on hand at the end of the Marketing Year: World, World Less China, and US

Source: Dr. Mark Welch; USDA, WASDE
U.S. Supply and Demand
The November WASDE was, if anything, bearish, with contracts through the middle of next year sliding about 10 cents per bushel over the last week. However, Corn’s slide out of range-bound trading on the board began on November 2nd when Russia’s defense ministry released a written agreement that its military would not attack vessels on the Black Sea. That news coupled with a slight revision upward on corn yield in the WASDE lent downward pressure to the market. At the same time, downward revisions in yield, production, and final supply of sorghum will induce some downward pressure in that market. The WASDE did not revise prices for corn ($6.80/bu.) or sorghum ($6.65/bu.) from October to November.
November 2022 WASDE (11/9/2022)

What can we expect for next season?
With summer crop production largely complete, it’s time to begin looking to next season. With the prospect of ending stocks in 22/23 even lower than 21/22, we can expect sustained price strength in the coarse grain market through the winter and up to planting. What does that do to acres?
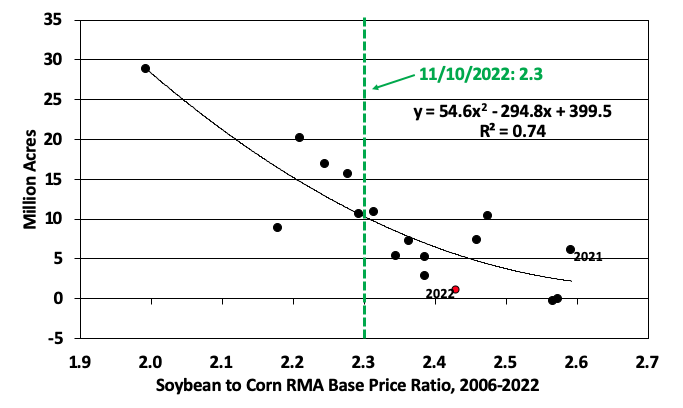
All else equal, lower stocks leading to strong prices should lead to more planted corn acres chasing those increased prices. Dr. Mark Welch’s estimate of corn acres relative to soybean acres is a function of corn base price relative to soybean base price.
Corn acres minus Soybean acres, and RMA Soybean to Corn Base Price Ratio

Source: Dr. Mark Welch
As of November, the relationship between the two crops would suggest roughly 10 million more corn acres than soybean acres. Assuming the 10-year average total acres split by the two crops (175 million acres), we can expect the price relationship to drive corn acres to roughly 92-93 million. This lines up with USDA’s long-term projections for 23/24 that have higher planted acres, trend line yield, and higher ending stocks. The net result is downward pressure on corn prices for the next crop year, a concerning trend given the sustained level of input costs.
For more information subscribe to Dr. Mark Welch’s weekly Grain Market Update newsletter here.