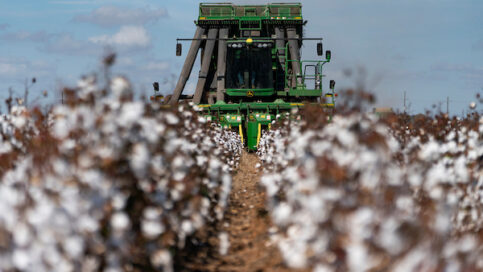
Cotton harvest on Oct. 20, 2021. (Laura McKenzie/Texas A&M AgriLife Marketing and Communications)
As harvest time approaches, the outlook for the 2025/26 cotton crop is starting to become clearer. In this post, we examine what the latest reports from the USDA reveal about cotton production this year.
The Current Cotton Production Outlook
Upland Cotton Production in the United States
Table 1 summarizes cotton production across the United States and Texas, as reported by the USDA. Since June, the USDA has revised its estimate of the national cotton area planted downward by 8%. If accurate, this will be the third smallest area planted in the U.S. since 2000. For Texas, the story is similar. USDA has decreased its estimate for planted acres by 7% since releasing the June acreage report. This will be the fifth-smallest area planted in cotton in the state since 2000.
While the USDA anticipates that harvested acres will be low compared to historical trends, abandonment is expected to be low as well. This year, the USDA projects that the U.S. will harvest 7.2 million acres of upland cotton from 9.1 million acres planted. This indicates a 21% national abandonment rate, which is below the ten-year average. In Texas, the USDA expects 3.6 million acres to be harvested from 5.3 million acres planted, resulting in a 30% abandonment rate. Over the past ten years, the average abandonment rate in the state has been 38%.
In terms of nationwide cotton production, lower abandonment is unlikely to offset the reduction in planted acres. The U.S. is currently expected to produce about 1 million bales less than in 2024. On the other hand, Texas production is expected to increase by approximately 1 million bales due to favorable growing conditions in the Panhandle and South Plains.
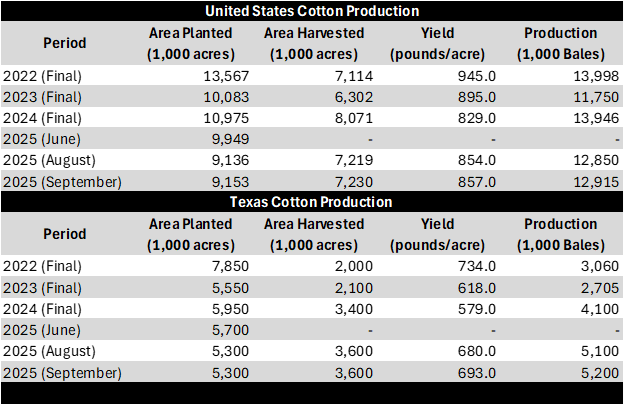
Table 1. U.S. and Texas Upland Cotton Production
World Cotton Production
To understand world cotton production, we examine the latest WASDE report (Table 2). USDA expects world cotton production (upland and ELS) to decrease by 1% compared to the previous marketing year. However, this represents a 4.5% increase over two years ago. In the report, production in China and India remains near their 2024/25 levels. In Brazil, production continues to grow, up 1.25 million bales relative to 2024/25 and nearly 4 million bales from 2023/24.
Table 3 shows how production in 2025/26 affects the U.S. cotton balance sheet. Currently, the USDA expects lower production, fewer supplies, and similar use compared to last year. This leads to a 400,000-bale year-over-year decrease in U.S. ending stocks. Globally, the USDA predicts no change in ending stocks this year compared to the previous marketing year.
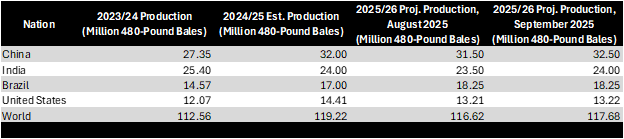
Table 2. Cotton Production by Major World Producers

Table 3. Projected Balance Sheet for U.S. Cotton
Where the Cotton Market Stands
Figure 1 shows the movement in the December ’25 ICE cotton contract from June 23 through September 19, courtesy of barchart.com. During this time, the contract has traded in a roughly 3.5-cent range from 66 cents/pound to 69.3 cents/pound. The market has reacted to production information provided by the USDA, most notably on June 30 and August 12. However, the market’s reaction has been short-lived. The price tends to shrug off any gains or losses within a few days and return to its previous trend.
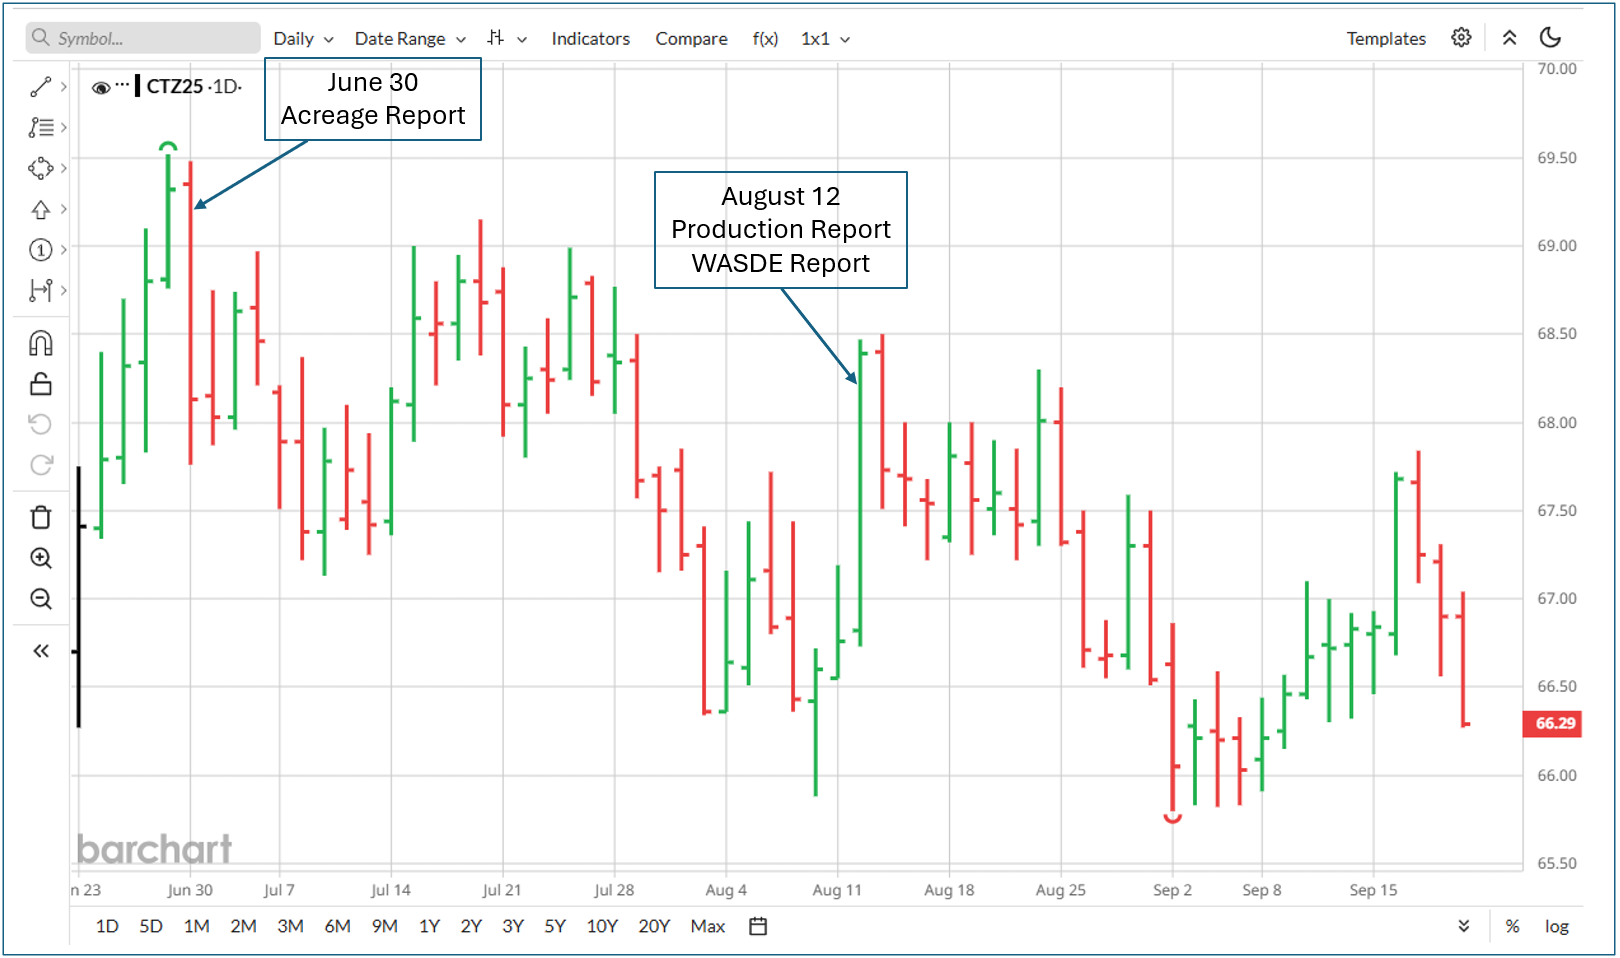
Figure 1. December ’25 ICE Cotton Price, June 23- September 19