2002 Annual report to the
National Crop Insurance Services
John W. Sij, Jason P. Ott, Todd A Baughman, and Brian L. S. Olson*
Texas A&M University Agricultural Research and Extension Center at Vernon
*(Kansas State University)
Introduction
There are thousands of acres of guar (Cyamopsis tetragonoloba) throughout the semiarid areas of Texas and Oklahoma. Guar can be characterized as an extremely drought tolerant summer annual legume that is adapted to the poor sandy soils found throughout the region. Guar produces a bean about ½ the size of a soybean. The endosperm of the bean contains galactomannan gum, an industrial gum used in paper sizing, petrochemical applications, cosmetics, and a host of other products. In addition, guar gum can be used as a thickening agent in ice cream, instant puddings, and in a variety of manufactured food items. Guar meal is also an excellent source of protein that can be included in animal feed. Currently, guar bean splits (germ removed) are imported from either Pakistan or India; therefore, development and promotion of guar production would be beneficial to agriculture in this area and supply an alternative source of the raw material for U. S. processing plants.
One obstacle to the adoption of widespread guar production is lack of crop insurance for natural disasters. Hail has been shown to decimate a field of corn or soybean beyond the point where it is economically beneficial for the farmer to harvest the crop. Little is known about the potential reduction in yields that can occur when hail strikes guar at different stages of growth. The objective of this study is to evaluate simulated hail damage on guar at two growth stages and three levels of simulated hail damage.
This report compares results of 2002 with that of 2001. Growing conditions in 2002 were good during most of the season. However, near maturity, excessive rainfall and prolonged wet, cool weather in October resulted in extensive bean quality deterioration. Prior to this wet weather event, the guar crop was extremely promising. Most guar in the area could not be sold due to its poor quality. This situation emphasizes the need to provide crop insurance for such natural disasters.
Methods and Materials
Treflan herbicide was applied on 5 April 2002 at a rate of 1 pt/A for preemergence weed control. The guar variety Kinman was planted on 11 June 2002 in a Miles fine sandy loam on a conventional-tilled field to achieve a population of about 3 to 4 plants/ft. After guar emergence plots were maintained and kept weed-free via chemical weed control or hand hoeing. Plots consisted of three rows on 40-inch centers with a length of 25 feet per plot.
A commercial grass trimmer was used to simulate hail injury, and consisted of a target removal of 0, 33, 66, and 90% of the above-ground biomass. Injury treatments were applied at either 6 or 12 weeks after emergence (WAE). Practice runs to visually gauge the extent of guar damage were initiated prior to applying the simulated hail damage treatments. The actual amount of biomass removal for each treatment is illustrated in Figure 1. Each growth stage by simulated hail injury treatment was replicated 6 times.
All three rows of each plot were flailed with the grass trimmer to simulate various degrees of hail damage. After treatment, three feet from the middle row was harvested and dried. Three feet of untreated plants adjacent to the treated plots was also harvested and dried in order to calculate percent simulated hail damage. Fifteen feet of each plot was harvested after the first frost and yield (13 % moisture) was calculated on a pounds per acre basis.
Data were subjected to analysis of variance for a randomized complete block arrangement of treatments. Means were separated using protected LSD and were considered different at P < 0.05.
Results and Discussion
Wet conditions prevailed in May and prevented planting until early June. Excellent stands were obtained. A relatively dry period followed and plants made good growth. In July, additional rains fell resulting in favorable plant development. Generally, the area’s environment was more normal than abnormal. As plants matured in October, the area experienced a period of cool, wet weather, resulting in rapid deterioration of bean quality. Consequently, bean yields were considerably below those of 2001.
It is difficult to match targeted defoliation percentages with actual defoliation percentage. However, our results in 2002 were better than those in 2001 as we gain experience in this hail damage simulation technique (Fig. 1).
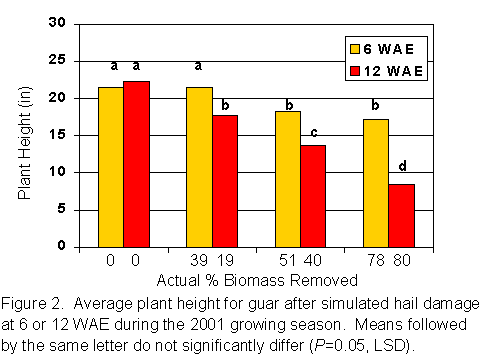
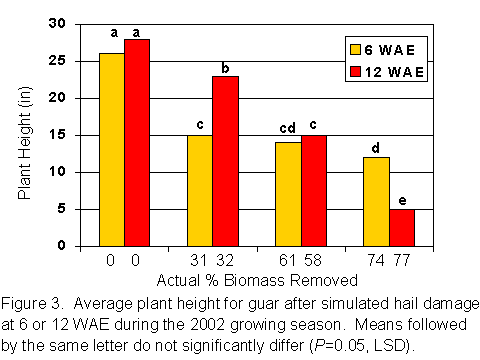
Due to favorable weather early in the growing season, plant heights in control plots in 2002 were higher than those in 2001 (Figs. 2 and 3). In 2002, plants did not recover as well as from the 6 WAE treatment as they did in 2001. The reason may be due to the wet period at the time of defoliation that may have retarded recovery in plant growth. Nevertheless, the inverse relationship between increasing defoliation and decreasing plant height was apparent both years.
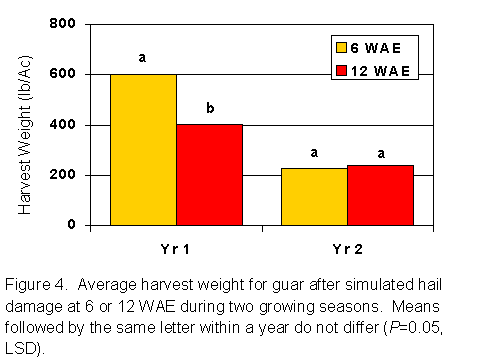
There was no significant difference for bean yield between treatment times in 2002. Bean yield for both the 6 WAE and 12 WAE treatments averaged higher in 2001 than in 2002 (Fig. 4).
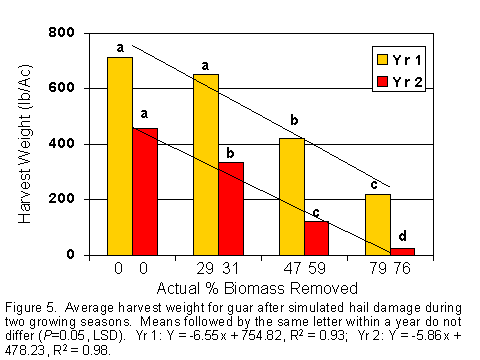
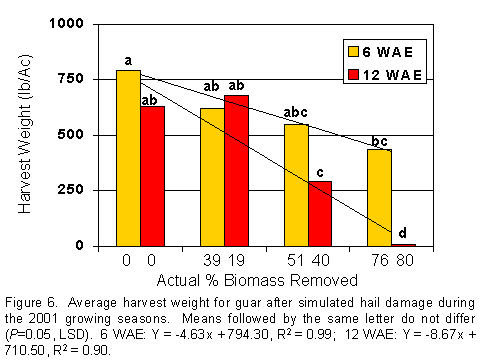
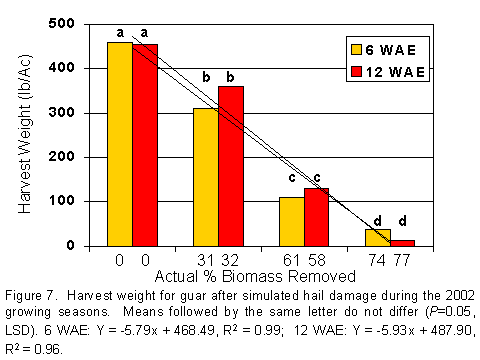
In control plots, bean yields were reduced 37% in 2002 compared with those in 2001 (Fig 5). The reduction in yield in 2001 and 2002 was nearly linear as percent biomass removal increased (Fig. 5). There was no interaction between percent biomass removal and removal date for yield in either year. Figures 6 and 7 show data for the individual years. In Figure 6, we failed to reach the 33% defoliation level, removing only an average of 19%. Hence, we believe yield would have been reduced to a greater extent than shown and more in line with data shown in Figure 7 at a similar defoliation level. In 2002, plants failed to recover from any level of damage 6 WAE (Fig. 7). There was some recovery from damage 6 WAE at the highest level of defoliation in 2001 (Fig. 6).
At 6 WAE guar already has pods forming. The growing season for guar is only 110 to 120 days. Because dry conditions usually prevail from July through August plant recovery from damage under these conditions appears marginal when damage occurs 6 weeks or more after seedling emergence.
With only two year’s of data, we attempted to model the extent of yield reduction with amount of biomass removed. A linear model provided a very high correlation between amount of biomass removal and yield reduction with R2’s of 0.90 to 0.99 among treatments. Linear models were included in the figure descriptions in Fig. 5-7 to show these relationships. We interpret the model to mean that guar may be sensitive to nearly all levels of mechanical damage 6 WAE or later. In the present study, a 30% biomass removal level will affect grain yield if guar is damaged between 6 and 12 WAE. It is not certain if it is statistically possible to show yield reductions if damage is 20% or less, or to what extent guar will recover if damage occurs at an earlier growth stage. These results indicate that additional defoliation information should be obtained from younger plants (2-4 WAE for example) to provide a more complete model to better assess the effects of hail damage on guar.
Acknowledgement
We wish to acknowledge Dr. Mark Zarnstorff, Director of Agricultural Research/Technology, The National Crop Insurance Services, Overland Park, Kansas, for his company’s support.

