Discussion
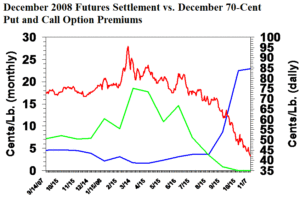
This graph shows daily settlement prices for Dec’08 futures from about fourteen months out through expiration (red line). The blue and green lines show the premium value associated with 70-cent put and call options, respectively. This year saw unprecedented price volatility, the inexplicable price spike in early March, and a dramatic price decline (in concert with all commodities) in the summer/fall. Major hedging opportunities were available provided the option markets were operating normally (which they weren’t in early March). The post-spike volatility resulted in a large increase in option prices. Still, an inexpensive put option in mid-April would have paid huge dividends in the event of the price decline (which most people did not see coming… that’s why the put option was so inexpensive in mid-April). This is an example of how a relatively inexpensive put option works as an insurance strategy against a very unpredictable outcome (i.e., external market forces driving down all commodity markets). This example is similar to the 2004 case, except perhaps the price decline of 2004 was a little more predictable (but still ultimately uncertain).
