What is Vulnerability?
Vulnerability, unless otherwise specified, includes the full suite of hazard risk assessment terminology, making no real distinction between risk, vulnerability, exposure, sensitivity, etc., although all of these can be teased out separately to some benefit (e.g., see Füssell and Klein, 2006). The issue here is simply to know where problems, such as flooding or storm surges, are occurring or are likely to occur in the future, who or what might be at risk in those areas, and how well they or it might be able to cope with the problems.
How is Vulnerability Assessed?
Assessing vulnerability is a key part in the development of any kind of mitigation plan, but knowledge about present and future vulnerability is so crucial that it merits separate treatment. Planners need to have ready access to vulnerability data, and citizens need to be able to fully understand all the risks associated with living in a coastal hazard zone, including the chances for stronger and more frequent storms, and flooding and rising sea level, for plans to have much meaning or acceptance.
- Building on Deyle et al. (1998), a vulnerability assessment begins with a solid inventory of the hazards (termed a “risk hazard analysis”). Where and how often does it flood? How far inland and to what elevation might we expect storm surges? The FEMA 100-yr and 500-yr floodplain maps are generally the fallback information available to any community.
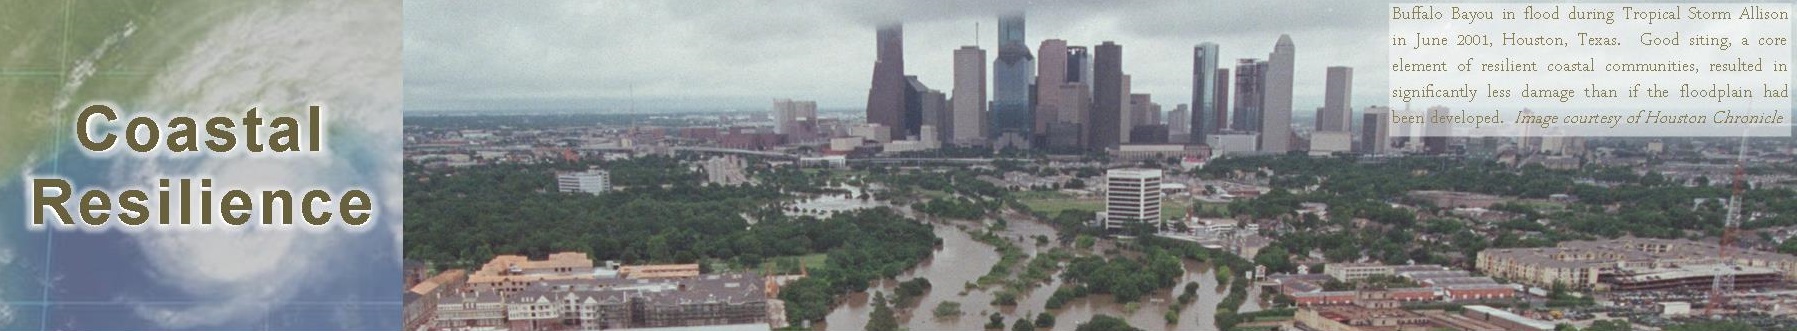
- These maps, however, are not always as accurate as they need to be and local communities may want to invest in developing their own maps with greater detail and precision (Larsen et al., 2003). After Tropical Storm Allison, the most damaging storm ever to hit Houston, Harris County and FEMA invested heavily in new technology to completely remap the floodplains of the county with much greater detail and reliability (Quarles et al., 2002).
- The next task in the assessment is to inventory what/who is in the hazard zones in terms of people, kinds of buildings, houses, roads, sewage plants, etc. (vulnerability assessment for Deyle et al {1998}). What kind of special risk facilities, such as chemical plants, are found in the hazard zones?
- Lastly, some idea as to the state of both the infrastructure and the people in the hazard zones is needed (risk analysis by Deyle et al., {1998}, with some overlap with their vulnerability assessment). What buildings are likely to withstand storm surges or flood damage? How hardened are the sewage and chemical plants to storm damage? Which populations are most at risk in terms of potential damage suffered and their ability to evacuate?
There are many more aspects and details involved with a complete hazard vulnerability analysis than have been addressed here. There is an entire literature dedicated to this subject (e.g., Mileti, 1999; Smith, 2004) that we cannot even begin to cover here. But it is not the details that are important, so much the ways policies that enable adaptation to climate change impacts can be integrated into the overall coastal natural hazard reduction framework, such as it exists. Clearly, a robust and detailed assessment of coastal storm surge and flooding potential will enable more precise placement of whatever buffer or freeboard is necessary to accommodate climate change impacts. Coastal communities that are unclear on the details of how natural hazards impact their community are unlikely to appreciate the need for additional freeboard for climate change impacts, much less what that additional buffer might look like.
Tools for Assessing Vulnerability
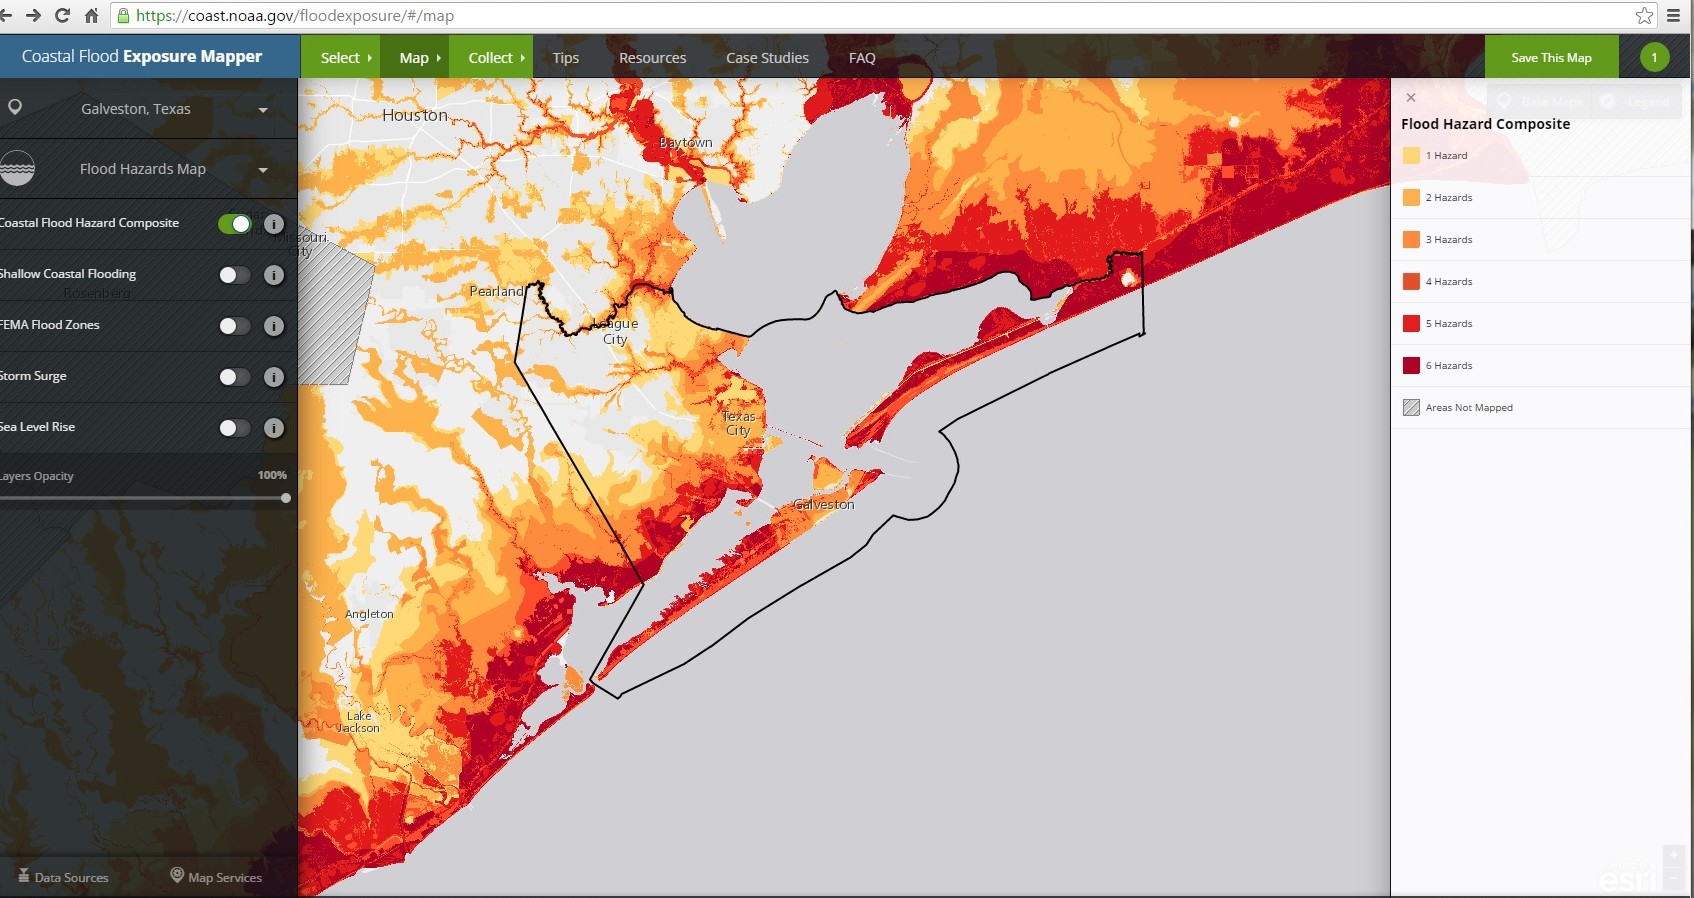
Coastal Flood Exposure Map, NOAA This screenshot shows composite coastal flood hazards in Galveston County, Texas. Societal, infrastructure, and ecosystem risks can be overlaid to assess vulnerability.
Coastal Resilience Mapping Portal – http://maps.coastalresilience.org/network/
Coastal Flood Exposure Map – https://coast.noaa.gov/floodexposure/#/splash
C-CAP Land Cover Change Atlas – https://coast.noaa.gov/digitalcoast/tools/lca
Hazards U.S. Multi-Hazard (HAZUS-MH) – https://www.fema.gov/hazus
Getting to Resilience: A Community Planning Evaluation Tool – http://www.prepareyourcommunitynj.org/
Sea Level Rise Viewer – https://coast.noaa.gov/slr/
U.S. Climate Resilience Toolkit – http://toolkit.climate.gov/
National Flood Hazard Layer – http://fema.maps.arcgis.com/home/webmap/viewer.html?webmap=cbe088e7c8704464aa0fc34eb99e7f30
Coastal Flood Loss Atlas – http://fema.maps.arcgis.com/home/webmap/viewer.html?webmap=b4ae0b42789447b18c4b919682b848ad
National Sea Grant Resilience Toolkit – http://seagrant.noaa.gov/WhatWeDo/ResilienceToolkit.aspx